
Trading the crypto market can be challenging, especially when you are new to this. It requires more than hodling, buying, and selling crypto assets if you aim to become a successful investor and trader in this industry that provides so many opportunities to people who want to take their chance.
Trading the financial market, such as crypto, stock, indices, and the future market requires skills, patience, and psychology to stay ahead of the game. Investors and traders are always looking for ways to stay profitable in the crypto space by adopting different trading strategies and technical analysis tools and using indicators, oscillators, and chart patterns to have an edge and remain profitable in a bullish and bearish market.
With the ever-growing trend in the crypto market, studies have shown that the crypto market ranges by over 70% of the time while the remaining percentage allows traders to spot trending opportunities.
In this guide, we will discuss one of the chart patterns traders and investors use to spot trend reversals and position themselves for high rewards as the market reverses in their favor.
We would discuss extensively how traders use the cypher chart pattern with examples for you to increase your knowledge, make gains in the market and manage your risk accordingly. Let us discuss how to draw and trade the different cypher harmonic patterns.
What Is The Cypher Harmonic Pattern?
The cypher harmonic pattern is a trend reversal pattern used by technical analysts to spot price action trend reversal in trading assets across the financial market, such as crypto, forex, futures, stocks, and indices. This pattern is not very commonly used among traders but is an effective and efficient tool that increases profitability when used well.
Darren Oglesbee first birthed this relatively advanced chart pattern formation; due to its structural formation and unique Fibonacci ratios, it is not often used as a chart pattern among traders.
The cyber harmonic chart pattern has the same pattern and structure as other harmonic patterns like Gartley, Bat, and Butterfly patterns. The cypher chart pattern can be either bullish or bearish and comprises four separate price legs that relate to Fibonacci ratios.

The points on the cypher chart pattern are five in number (X, A, B, C, and D) and for legs (XA, AB, BC, and CD) with a strong correlation to Fibonacci ratios and price movement with the market expected to make a reversal from point D during its swing wave movement.
The cypher harmonic pattern is mostly found in a trending market phase and appears at the end of the phase, indicating a potential reversal in the asset price.
In an uptrend formation, the legs of the cypher chart pattern make higher highs and higher lows when drawn. For a downtrend formation, the cypher chart pattern makes lower lows and lower highs during this formation, making the shape of the cypher harmonic pattern looks like a zigzag pattern.

From the image above, this is a bullish cypher harmonic pattern made up of five point structure represented by XABCD with four individual legs that make a pattern. The first leg is the XA leg, the second is the AB leg, the third is the BC leg, and the final leg is CD. From the image, the AC leg forms a higher high while the BD leg forms a higher low, with the entire structure having a zigzag structural pattern.
What The Cypher Pattern Tells Us
To explain clearly the points and legs of this pattern for better understanding and how they combine with the Fibonacci retracement ratios. The initial leg of the cypher pattern is XA, and the second leg of the harmonic pattern is leg AB; this retraces a portion of the XA leg. The second pattern AB is corrective. The third leg pattern is the BC which extends beyond point A. The final leg CD retraces the entire move from X and C.
We would have the following to combine the different legs with the Fibonacci retracement ratios. The AB leg must not retrace the XA leg by 38.2% and should not exceed 61.8% for the Fibonacci ratio.
The point at C holds a minimum 127% projection of the XA leg, with the measurement of B. Point C should not exceed 141.4%, whereas point D terminates the pattern as it closes near 78.6%.
How Do You Identify a Cypher Pattern
Several conditions must be met for the cypher harmonic pattern to be fulfilled, just like other harmonic patterns. Here are the conditions that meet the Fibonacci ratios you need to consider, as discussed above.
- B point is a retracement of the XA leg at a range of 38.2%-61.8% levels.
- The C point is an extension leg with a Fibonacci ratio of 127.2% to 141.4% of the primary XA leg.
- D point should break the 78.6% level of XC leg terminating the pattern.
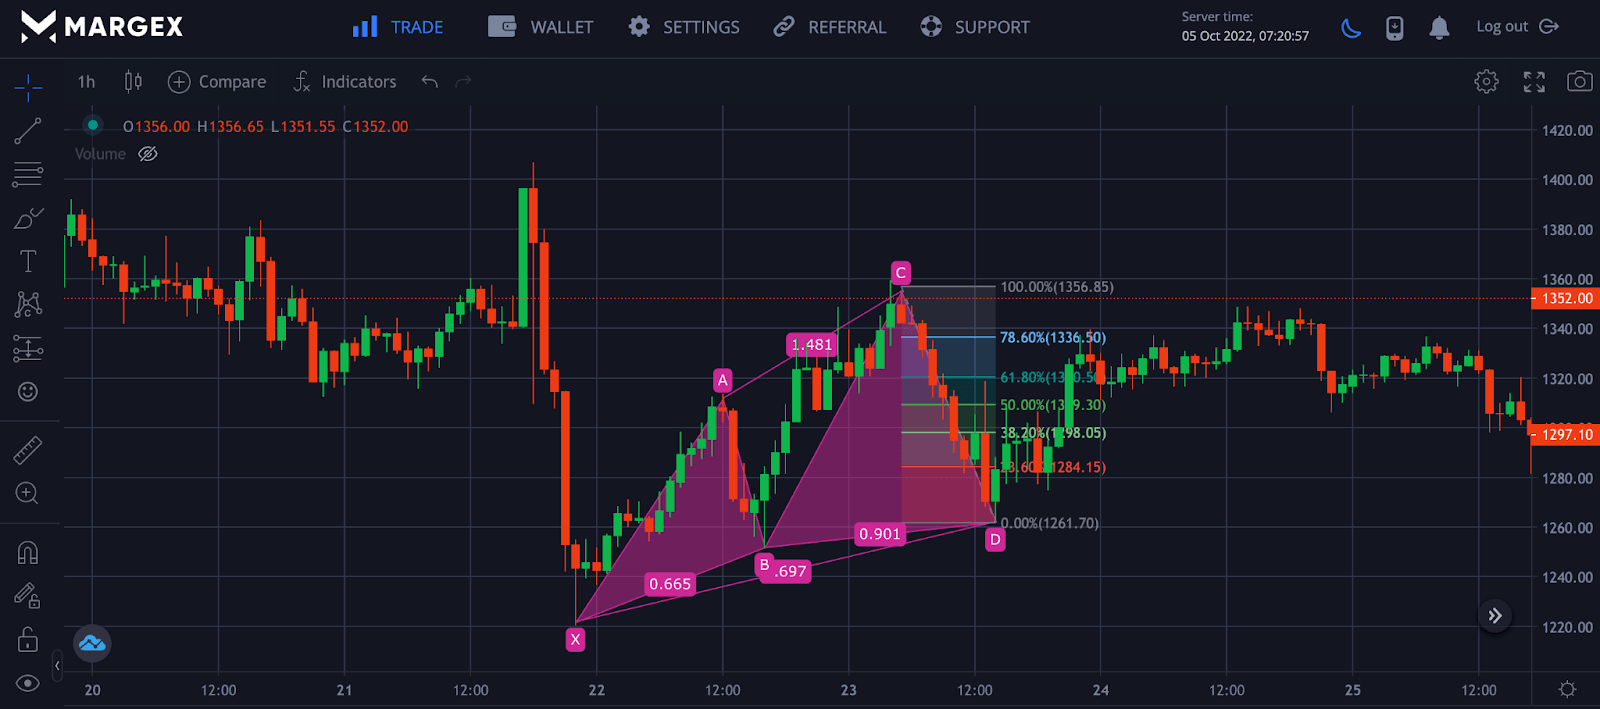
The image above shows a bullish cypher pattern for ETHUSD with all conditions met, as discussed above. The D point terminates the pattern; as a trader, you could look to enter a long position at 78.6%, which corresponds to the Fibonacci retracement value with taking profits set for 38.2% and 61.8% Fibonacci ratios, respectively, with a stop loss placed a few distances away from point X or you could use the Average True Range (ATR) to determine where the stop loss should be placed to avoid stop the hunt and minimize the risk in trading these assets.
Bullish Cypher Pattern
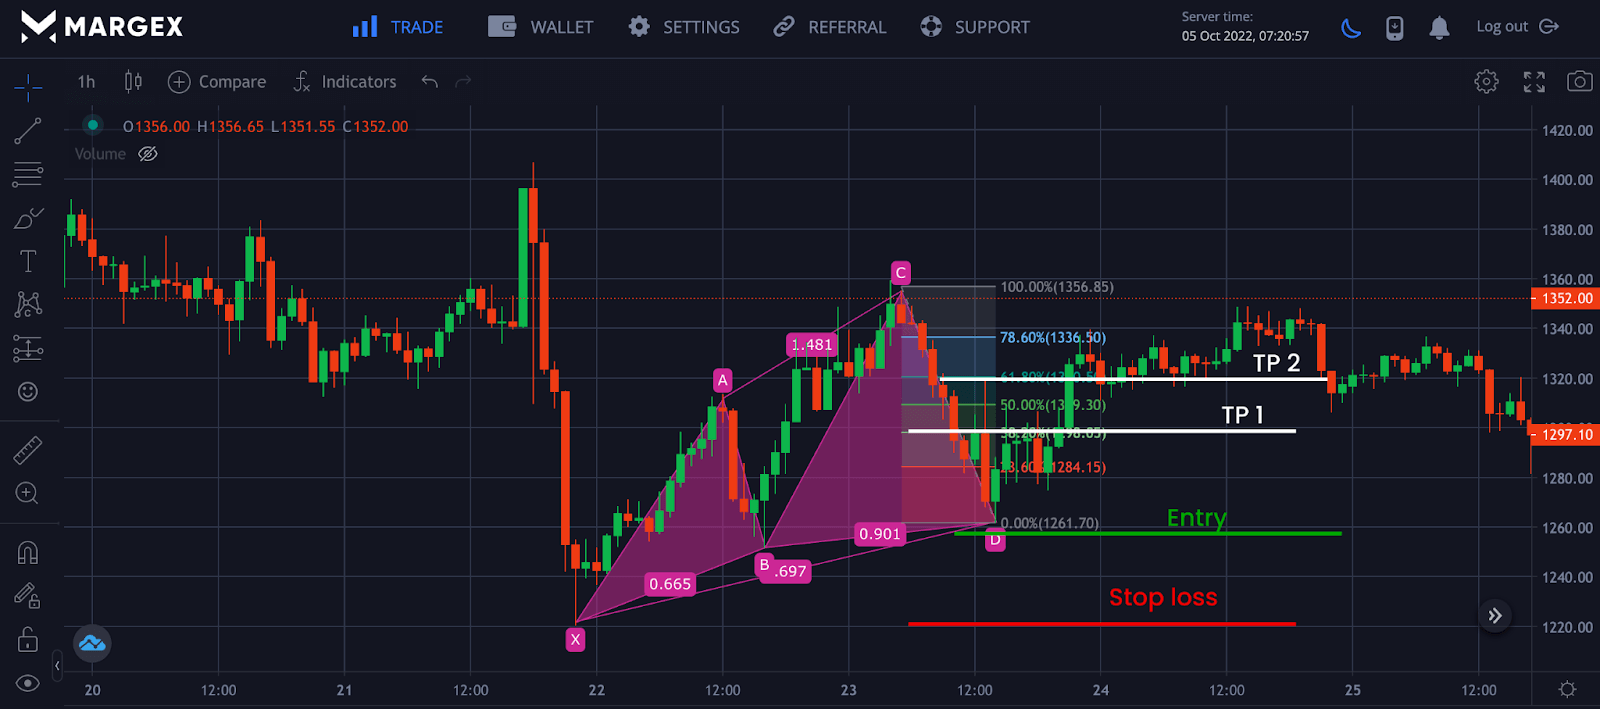
The image above shows a bullish cypher harmonic pattern that starts from leg XA with a retracement to point B, creating leg AB with price moving to a high of C, creating leg BC and a final retracement of the movement to point D, forming leg CD completing the formation of the bullish cypher pattern for ETHUSD pair.
Point X to point A show a swing high, and point B to point C shows another swing higher above point A, completing the formation of a higher high for the bullish formation of the cypher harmonic pattern, as seen above.
At the completion at point D, a trader could look to enter a long position at $1260 with taking profits set at $1290 and $1320 and a stop loss below point X to minimize risk.
Bearish Cypher Pattern
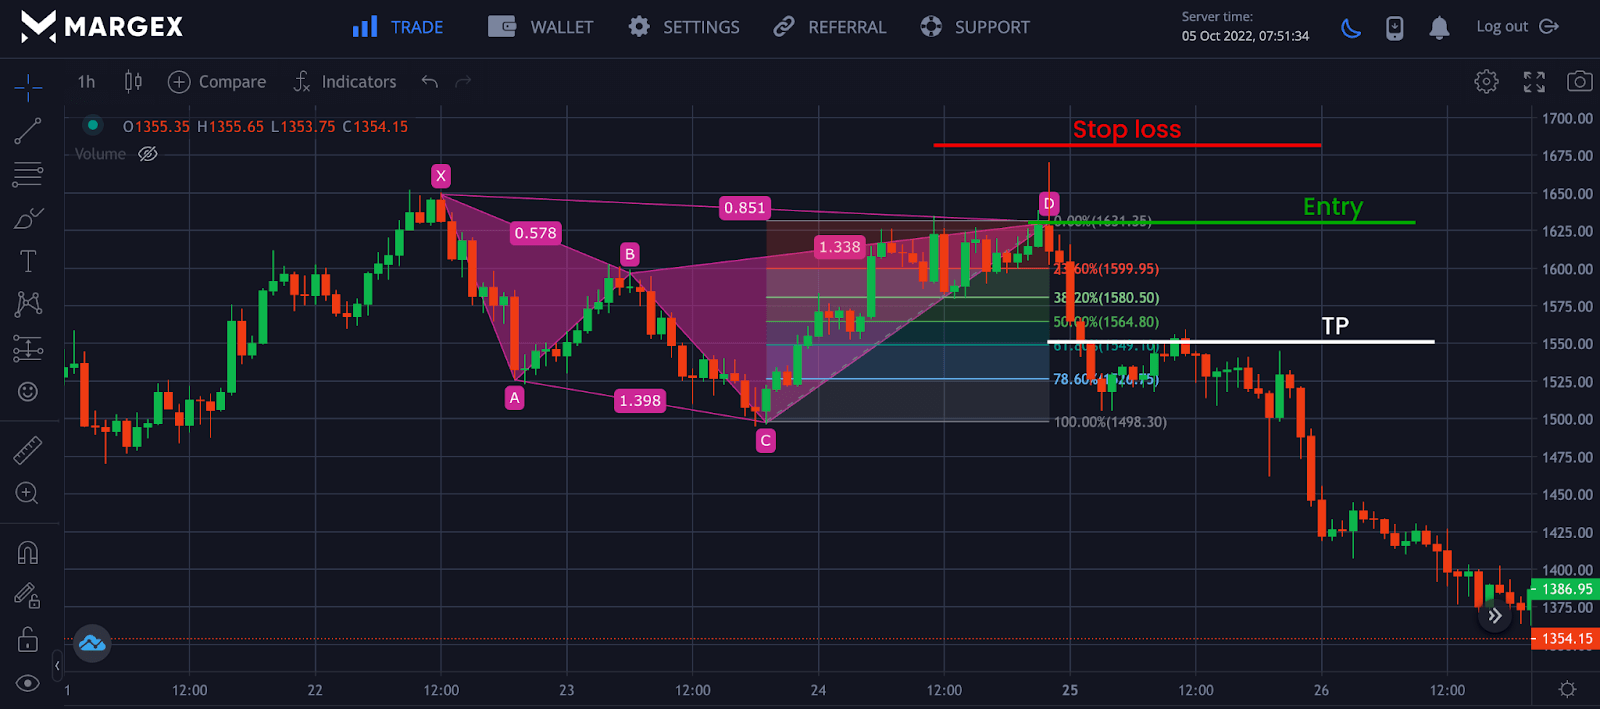
The image above depicts a bearish cypher harmonic pattern that begins with leg XA and ends with leg AB, with the price moving to a low of C and a final retracement of the movement to point D, forming leg CD, completing the formation of the bullish cypher pattern for the ETHUSD pair.
The points X to A show a swing low, and the points B to C show another swing low below point A, completing the formation of lower lows for the bearish formation of the cypher harmonic pattern, as seen above.
At point D, a trader could enter a short position at $1650 with a take profit set at $1550 or lower with a stop loss above point X to minimize risk.

How To Trade Crypto Using The Cypher Harmonic Candlestick Pattern (With Screenshots From Margex Platform)
Margex is a bitcoin-based derivative exchange that provides traders with the platform to trade with up to 100x leverage size and at the same time stake their tradable crypto-asset, making it possible to earn in both ways with up to 13% APY for your staking rewards. There are no lockup periods, and rewards from staking are sent to your staking balances daily with the help of the Margex automated system.
Margex places the interest of its users and values the security of assets, be rest assured that Margex provides the best unique features you can think of in the crypto space, making them one of a kind.
Although trading this cypher harmonic pattern can be rewarding for traders with good experience, let us see how we can use Margex to trade this pattern.
Before you can access this free technical analysis tool on Margex, you need to open an account as this is free, and as an existing user, you only need to log in to access all of the Margex features for free.
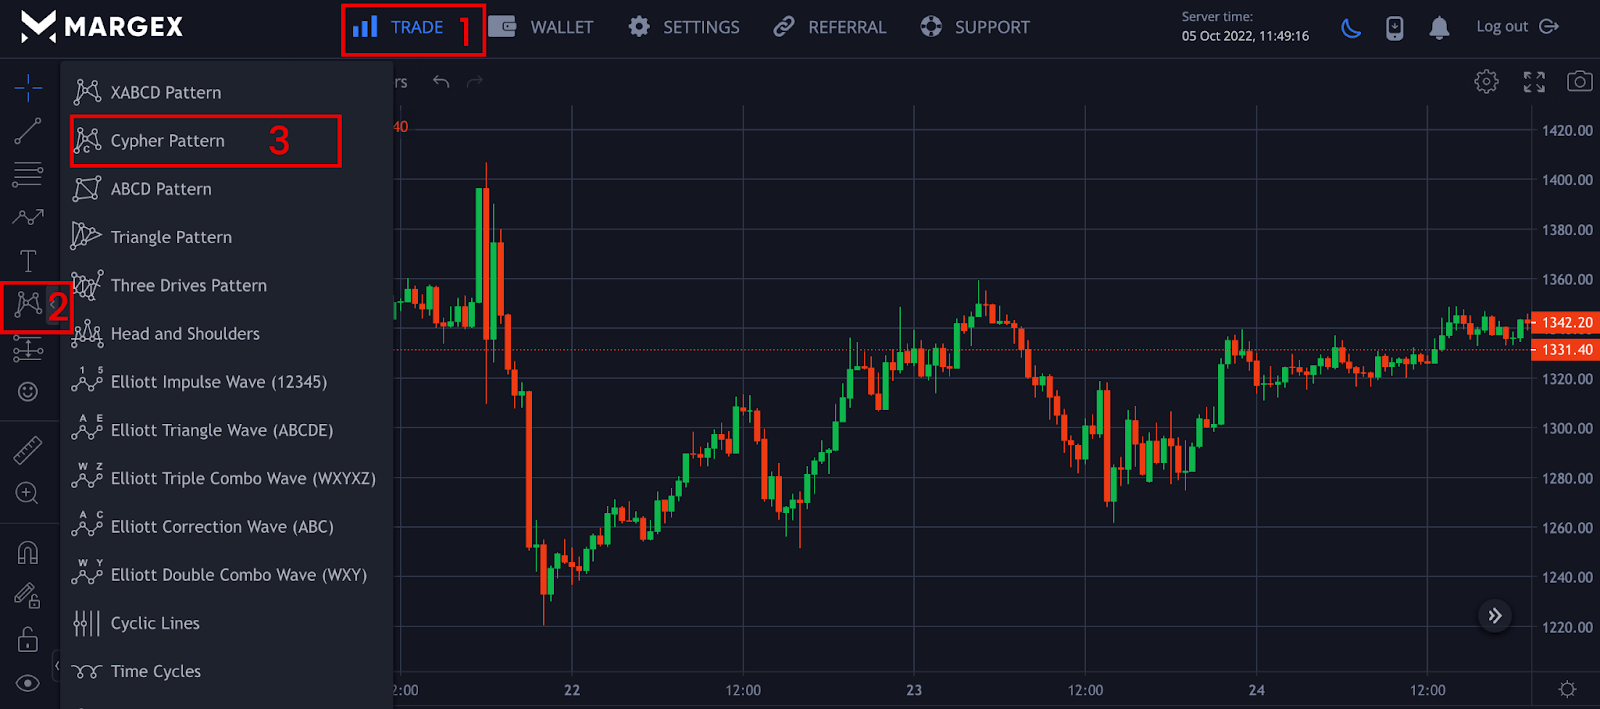
From the image above, following the number description makes it easy for you to use the cypher pattern during your trades. Let us focus on the steps you can take to use the cypher harmonic pattern to spot potential trend reversal and enter either a long or short position.
Step 1 – Drawing The Cypher Pattern On Margex
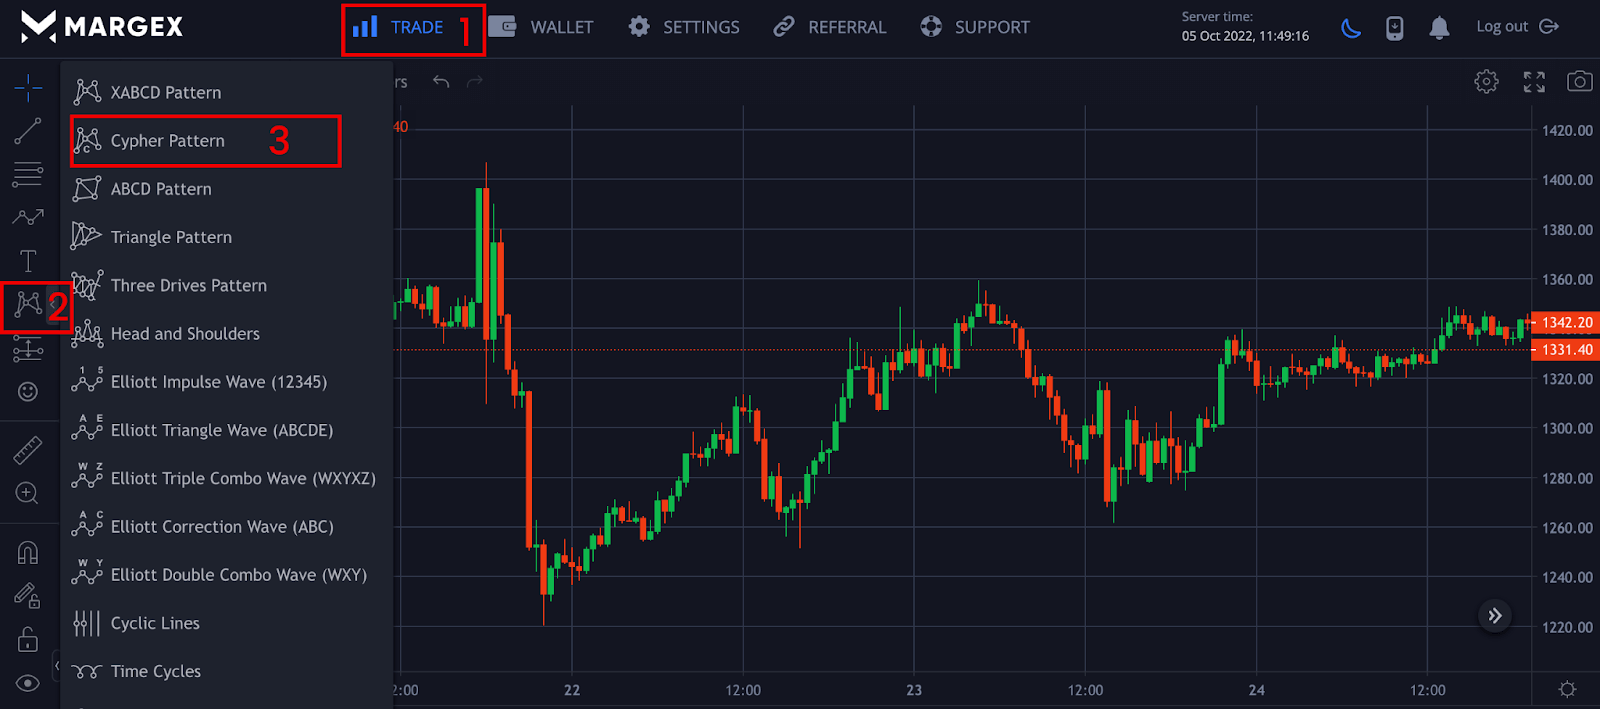
- On spotting swing points on your chart, head over to your technical analysis, take the section on the left, and click on the harmonic pattern indicator on the left-hand side toolbar of the Margex interface.
- Identify the starting point, X, and a higher high or lower low formation for either a bullish or bearish chart pattern on the chart, which can be any swing low or high point.
- Once you have identified your first swing high/low point, follow the market swing wave movements.
- The cypher pattern Fibonacci ratios must validate all swing high or low legs.
Step 2 – Trading Process
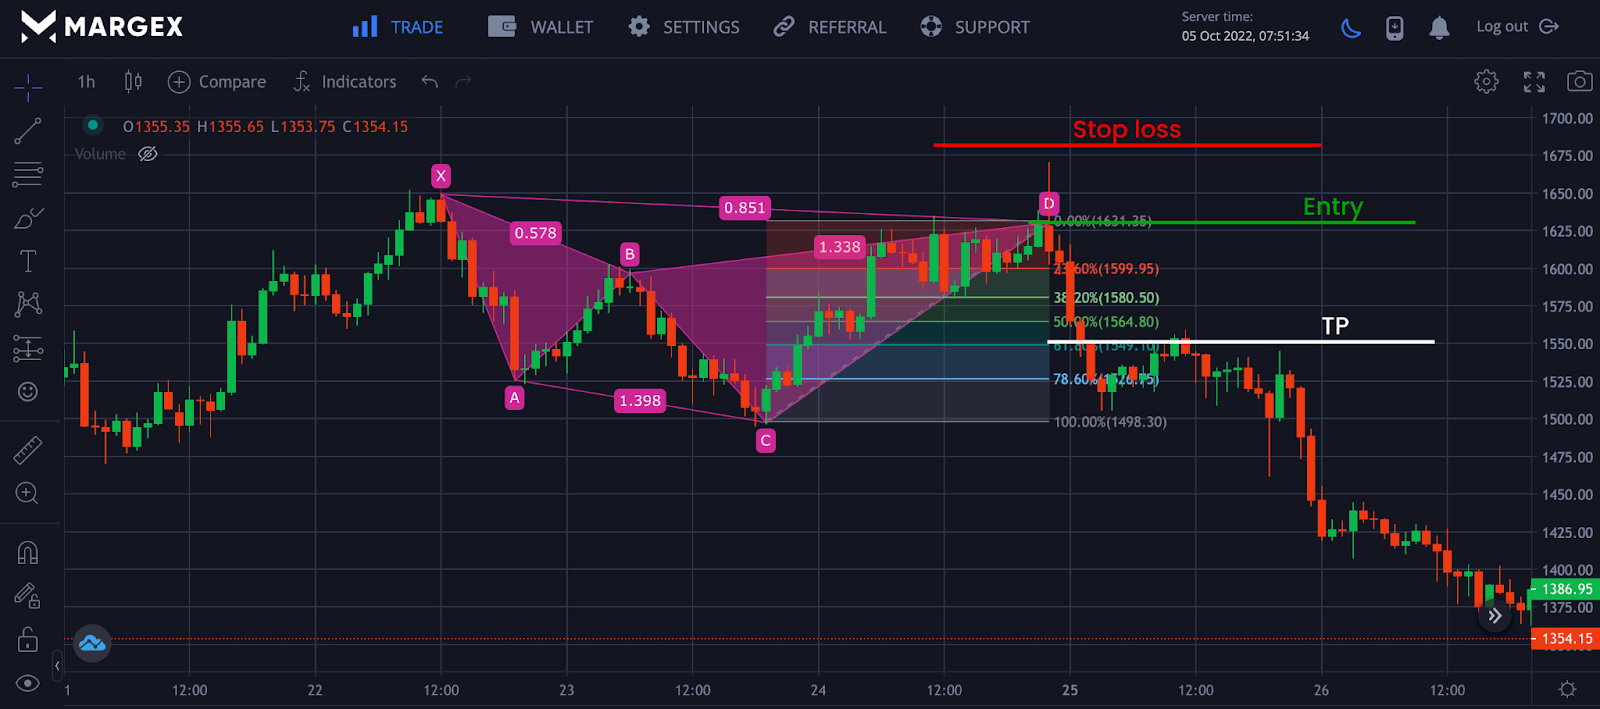
Haven identified all the criteria of the cypher harmonic pattern; let us trade the pattern following our trading methods.
Step 3 – Entry Point
The cypher pattern is an exciting technical analysis tool for proper risk management and has a good winning rate when applied correctly. Several studies and traders have identified the cypher harmonic pattern as dependable due to its trade success.
Entries for trades are set after the pattern at 78.6%, point D for either long or short positions, as this corresponds to the Fibonacci ratios.
Once the price touches the 78.6% region, the market is in place to have a reversal, and this is a good entry point for traders looking to enter the trade.
Step 4 – Stop Loss
Ensure you always use stop loss when trading the cypher pattern on spotting your entries to reduce risk and maximize profit. This pattern is not 100% certain and can be exposed during new events and extreme volatility in price action. Stop loss should be set a few distances away from point X. For a bullish cypher pattern, place the stop loss a few distances below point X; for a bearish cypher pattern, place the stop loss a few distances above the X point. The use of ATR can be used to set stop loss to avoid stop hunting.
Step 5 – Take Profit
The purpose of trading is to make a profit and reduce losses; there are many ways to make a profit using this cypher pattern; we would learn some tricks to employ during trading. One of the methods used by most traders is to scale out of trades when in profit, and the other is to lock profit to see how the trade turns out so as not to leave the trade too early.
The cypher pattern is a trend reversal strategy that enables traders to capture as much profit as possible. You could also use point A as a point to lock profit and trail the trade, and the Fibonacci ratios can be used for a time trend reversal.
Because the cypher pattern is one of the most profitable harmonic patterns, you can give it more breathing room. There is a chance that wave A will be retested.
Best Strategies For Trading With Cypher Pattern (With Screenshots)
Despite its accuracy, trading the cypher pattern alone in isolation is not the best strategy and can be exposed when there is extreme price action. We can combine the cypher pattern with divergences, indicators, oscillators, and even chart patterns for more accuracy and profitability.
Strategy 1 – Bearish Divergence With Bearish Cypher Pattern
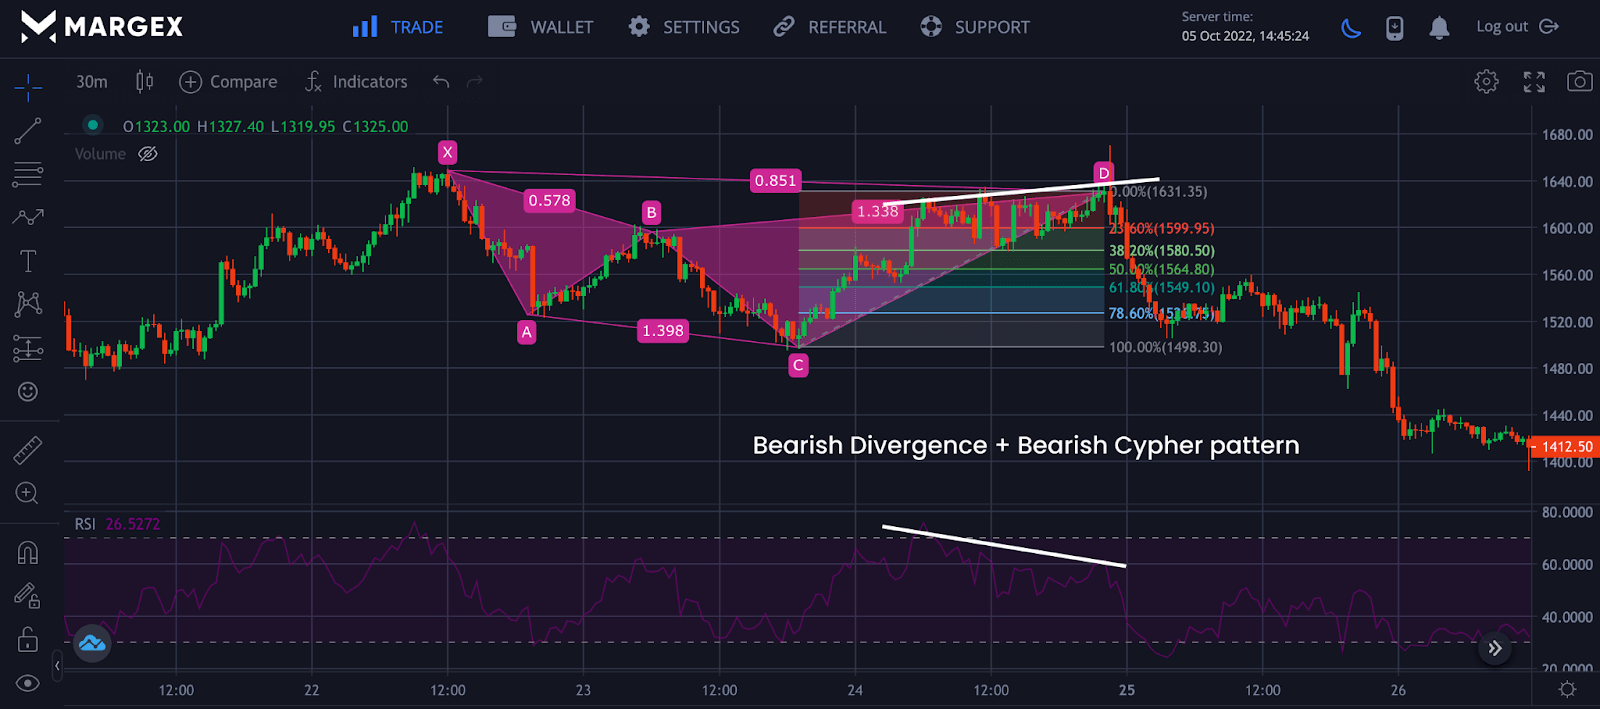
Trading the cypher pattern alone, despite its accuracy, would not be ideal as this can be exposed during extreme volatility in price action. Trading with more confluence and confirmation leads to more profitability for traders and reduces risk.
From the image above, the bearish cypher harmonic pattern indicated a potential bearish reversal in trend; for this trade to be taken or, for short, to be initiated by a trader, there needs to be more confirmation of the potential trend reversal.
During the 30mins timeframe, a bearish divergence formed with the Relative Strength Index (RSI). This confirms a potential change in trend from a bullish trend to a bearish one.
Using indicators like Moving Average Convergence Divergence (MACD), RSI, and others for confirmation will give you more and better entries and exits of trades.
Strategy 2 – Double EMA Crossover With Bearish Cypher Pattern
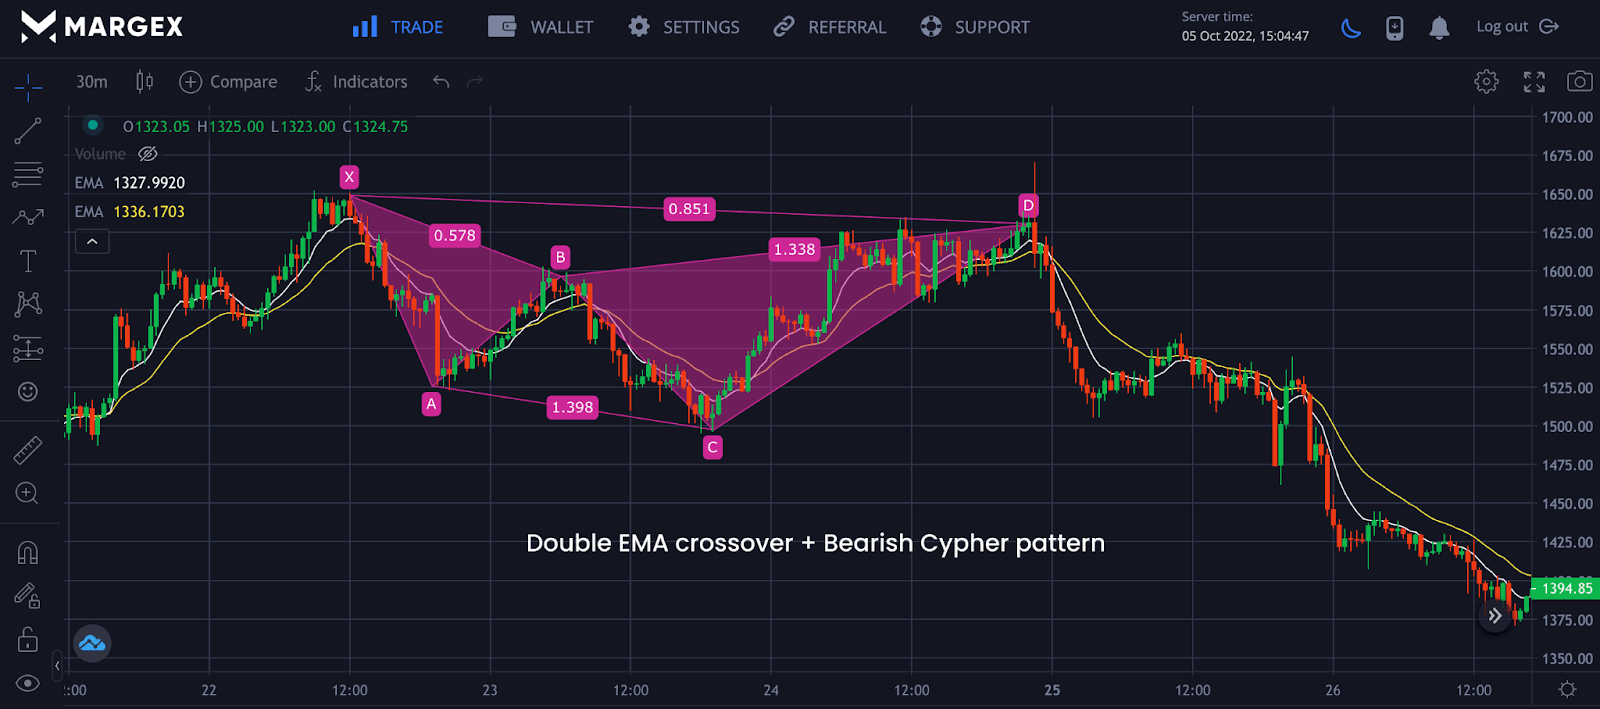
Another way to confirm our strategy of using the cypher pattern is by combining this strategy with a trend reversal strategy that most traders use. The Exponential Moving Average (EMA) is a technical analysis tool most traders use to spot trends and potential trend reversals.
The image above shows a confluence as the cypher pattern, and the EMA confirmed the potential downtrend with the EMA making a crossover. The close of the price below the EMA crossover indicates a confirmation of an imminent price reversal to a downtrend.
The EMA crossover is a strategy, when combined with market structures, works very well. The values for the EMA here are 8 and 20-day EMA, with the 8-day EMA responding faster to price change and making a crossover from top to bottom, indicating that trend reversal from bullish trend to bearish trend.
Strategy 3 – Chart Pattern Strategy With Bearish Cypher Pattern
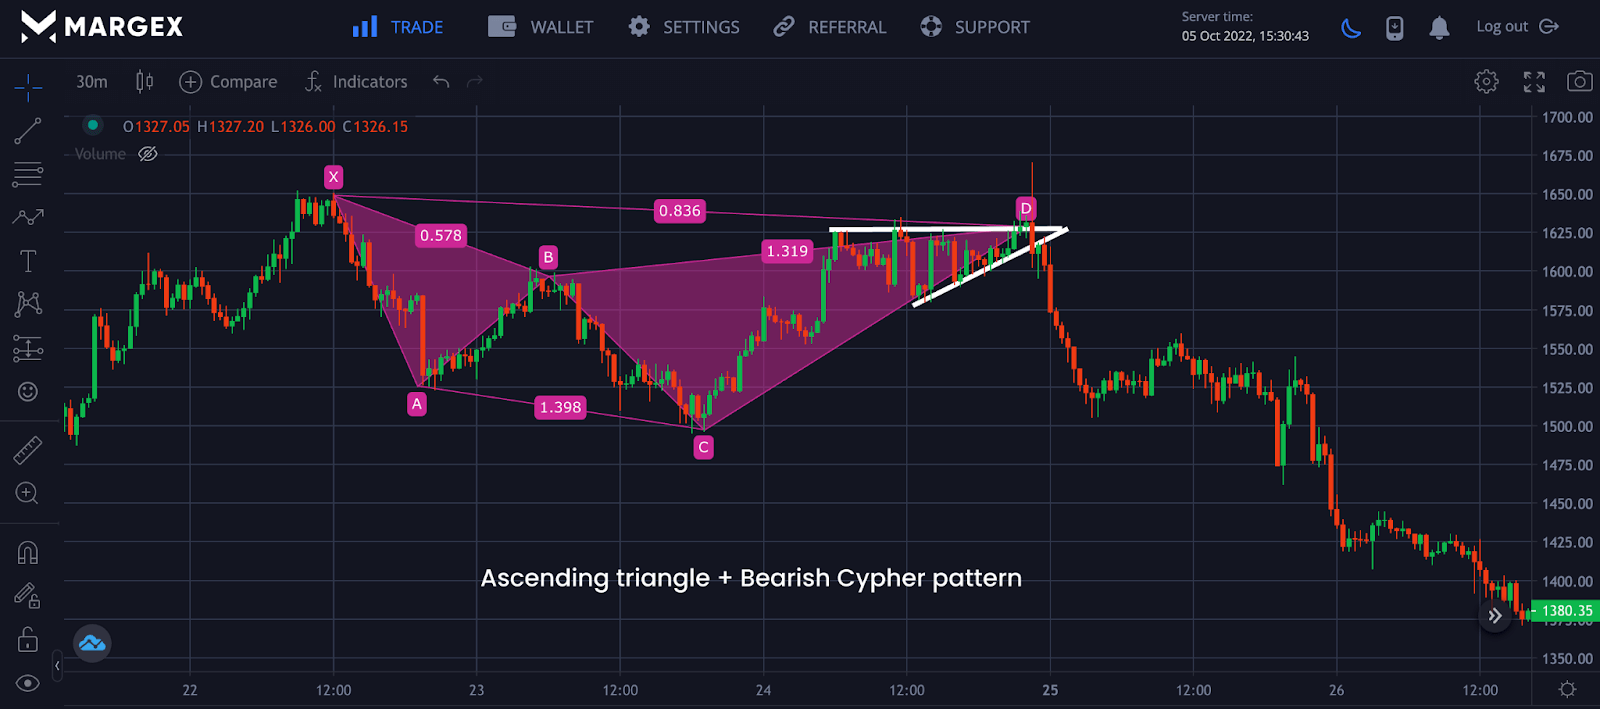
From the chart above, we can combine a common chart pattern strategy called the ascending triangle, a bilateral chart pattern depending on the price breakout. The breakout in price determines the price direction; the image above shows the breakdown in price as price heads to a downtrend, with this price direction being confirmed by the bearish cypher pattern formed. A trader could look for an entry to go short on in this trade after confirming the price going bearish as the trend reverses.
Pros And Cons Of Trading The Cypher Pattern
Like other harmonic patterns, some pros and cons come with this trading strategy. The pros that come with the usage of the cypher pattern are that it highly accurate, entry, exits, take profit, and stop losses are well defined.
The cons to using this trading strategy are that its an advanced charting pattern and not suitable for beginners, it is tough to trade with on lower timeframes, and it requires so much effort to master with other technical analysis tools for better trading strategies and confirmations.
Frequently Asked Questions (FAQ) As Regards Cypher Harmonic Pattern
Trading the cypher pattern can be confusing times and require skills to become profitable trading this pattern. Here are common questions traders have asked.
What Is Cypher Pattern?
The cypher pattern is a trend reversal chart pattern that technical analysts use to identify a change in trend or a trend reversal, either bullish or bearish. One of the lesser-known harmonic trading formations is the Cypher pattern. However, it is a powerful trading pattern you should learn and incorporate into your trading arsenal.
How Accurate Is Cypher Pattern?
Studies and traders who have a good understanding of this chart pattern have agreed on how reliable this harmonic pattern can be, with an accuracy of over 70%. When combined with other strategies, the cipher pattern is highly accurate with a high risk-to-reward ratio.
Is Harmonic Pattern Profitable?
The harmonic pattern is highly profitable, with over 70% accuracy for a chart pattern that is not very used compared to other harmonic patterns. Combined with other strategies and indicators like price actions, RSI, MACD, and chart patterns can be profitable with better entries, exits, stop loss, and take profits.
How Do You Make A Cypher Pattern?
There is no need to make the cypher pattern manually as this is available on the Margex platform; you only need to access your account by creating an account. For existing users, you need to log in to access all of Margex’s tools for trading. On spotting swing highs and lows, you could apply the use of the cypher pattern discussed so far in this article.
The cypher harmonic pattern is highly profitable. Adding it to your arsenal of trading tools takes you a step ahead of whales and institutions, helping you trade with more preciseness and well-defined entries, exits, stop loss, take profits, and timing trend reversal more accurately.


