
Investors and traders can improve the performance of their portfolios by performing technical and fundamental analysis in an attempt to forecast future price movements. At the core of any price movement, there must be a trend.
According to Dow Theory, trends form as primary trends, secondary trends, and minor trends. Prices can move in uptrends and downtrends in various timeframes within these different types of trends. The direction of the trend can be difficult to determine, and there are often times where there is a distinct lack of a trend and sideways trading range where consolidation takes place.
However, the formation of higher highs and higher lows, or lower lows and lower highs can help identify a bullish trend or a bearish trend. This type of market repeating market pattern, when broken, can foretell of a possible trend reversal and when to switch to using countertrend strategies.
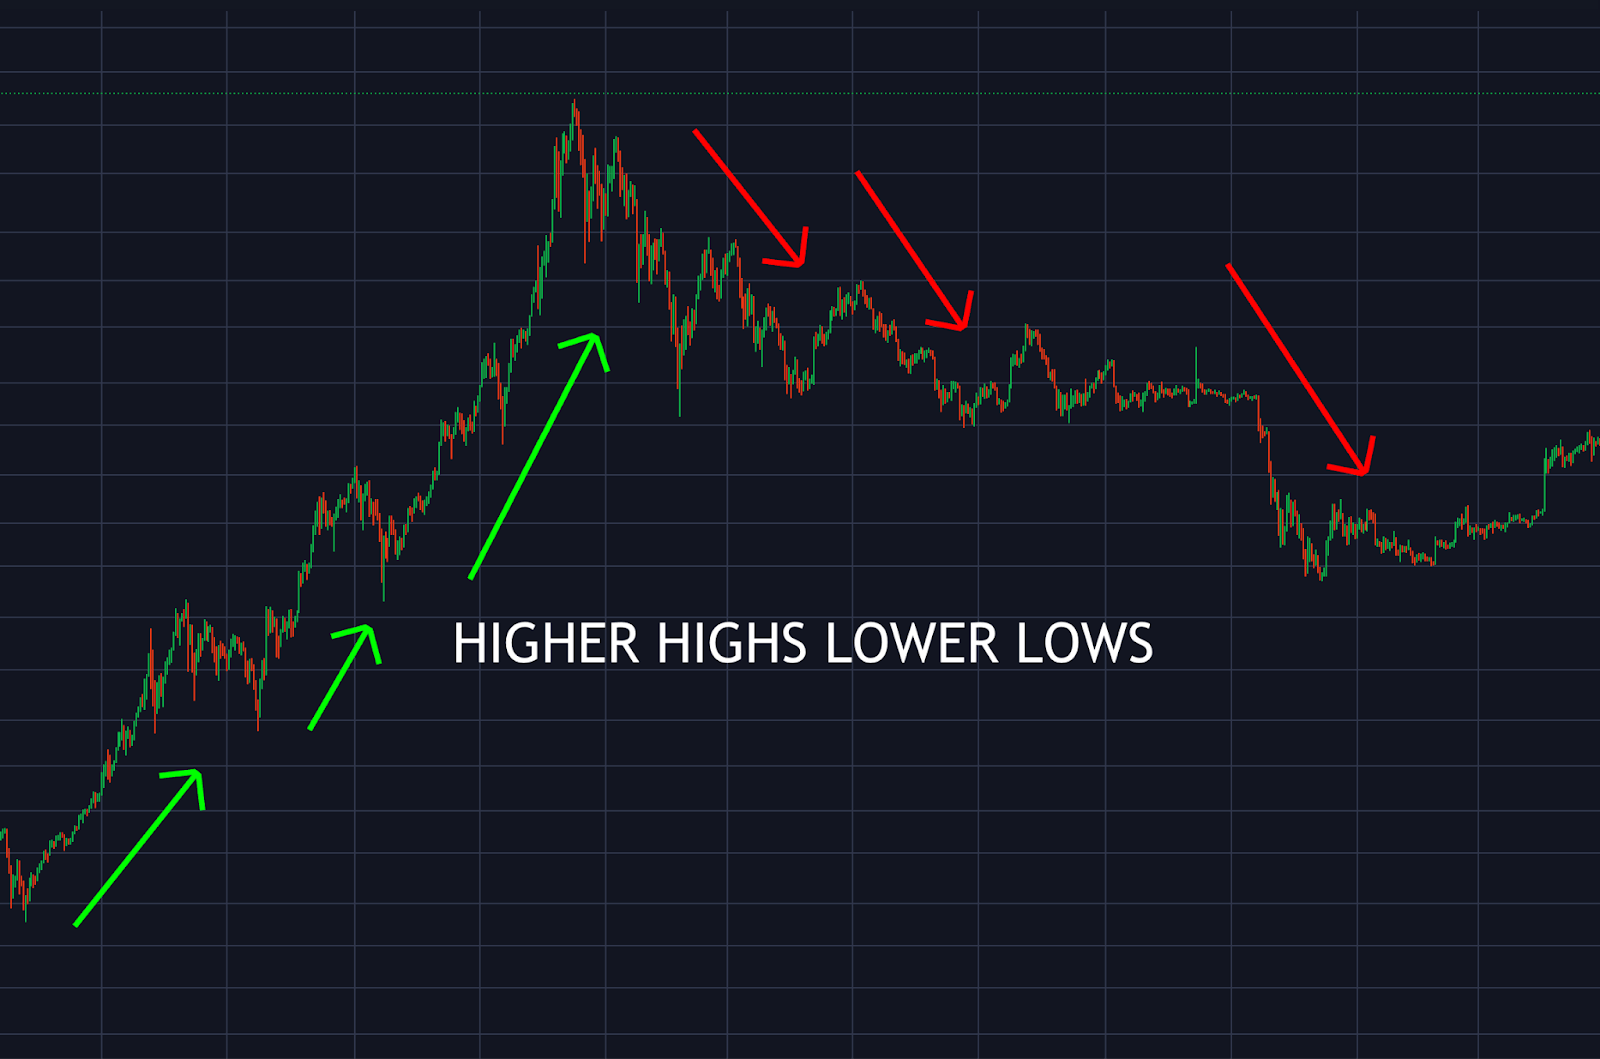
What Are Highs And Lows In Trading? Swing Highs And Swing Lows Explained
A high in the crypto market potentially refers to a local high, a longer-term swing high, or an all-time high. There is also a high during each trading session, which is represented by the upper shadow of a Japanese candlestick. For example, a new high is set for the trading day when the average gain is higher than the previous day.
A local high refers to a high during a minor trend, typically on the daily or lower timeframes. A swing high refers to a prominent market high during a secondary market trend. Swing highs can remain resistance levels for long periods of time. All-time highs can typically remain for several years, and some all-time highs in financial assets are never broken. All-time highs reflect the primary trend.

In contrast, a low in the market could refer to a local low, a longer-term swing low, or an all-time low. There is also a low during each trading session, which is represented by the lower wick of a Japanese candlestick. For example, a new low is set for the day when the average decline is lower than the previous day.
A local low refers to a low during a minor trend, typically on the daily or lower timeframes. A swing low references a dominant market low during a secondary trend. Swing lows can remain support levels for long periods of time. All-time lows can typically remain lows several years, and some all-time lows are permanent due to exponential price growth. All-time lows reflect the primary trend.
52-Week High And Low In Trading
Importantly, there is also another type of high and low: the 52-week high and low. The fifty two-week period is significant, because this is the annual or one-year price chart.
What Is A 52-Week High?
The 52-week high refers to the high set within the last one-year time period. This is an important metric for investors which is included on most cryptocurrency price aggregators as it reflects the potential performance of an asset historically, focusing on the most recent set of high timefarme data.
What Is A 52-Week Low?
The 52-week low refers to the low set within the last one-year time period. This is an important metric for investors which is included on most cryptocurrency price aggregators as it reflects the potential performance of an asset historically, focusing on the most recent set of high timefarme data.
What Are Higher Highs And Lower Lows? Defining Uptrends And Downtrends
When the highs and lows discussed above form in succession or in a specific pattern, it can tell the technical analyst if the market is up-trending or down-trending. Using trends this way can instill a higher level of trader confidence per-trade and warrant an aggressive trade entry.
An active trend also defines when to switch to trend-following trading indicators or other trend-friendly trading strategies.
Here is how using higher highs and higher lows or lower lows and lower highs can help traders determine the underlying trend and how that may impact the future value of the asset.

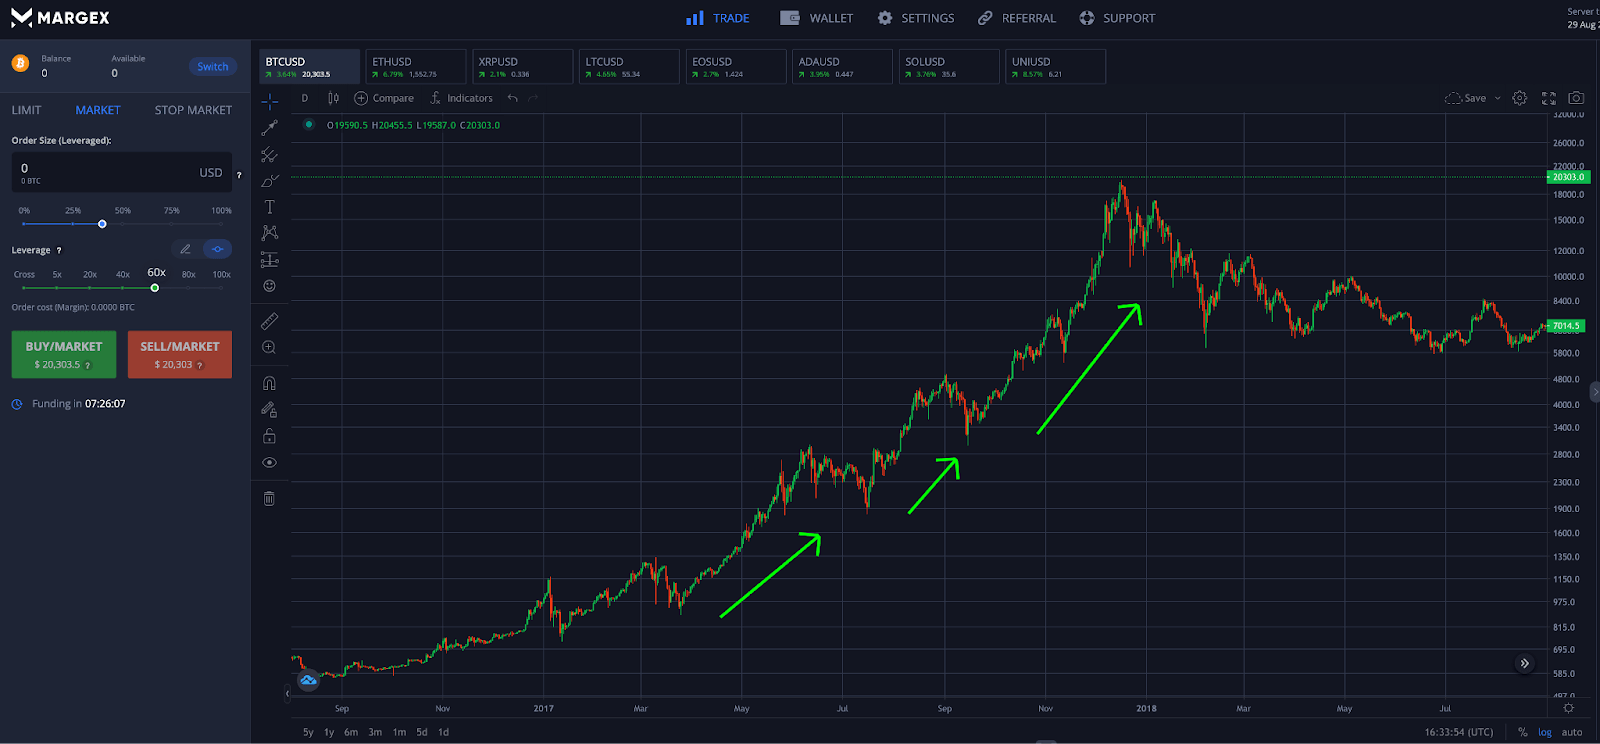
How To Identify An Uptrend? Higher Highs And Higher Lows Pattern
A series of higher-highs and higher-lows is typically an indication of a rising trend. It tells the market that buyers keep stepping in to buy each dip as there is a lot of demand and price support and prices have yet to reach a significant point of resistance or supply. In this type of high trading environment, prices can increase quickly without many pullbacks.
A bullish trend in cryptocurrencies can often turn into an impulse where a lot of traders participate. Impulsive moves are an ideal trend for a buy trade. A bull market is also the best holding period for those who hold spot crypto positions in addition to taking leverage long positions.
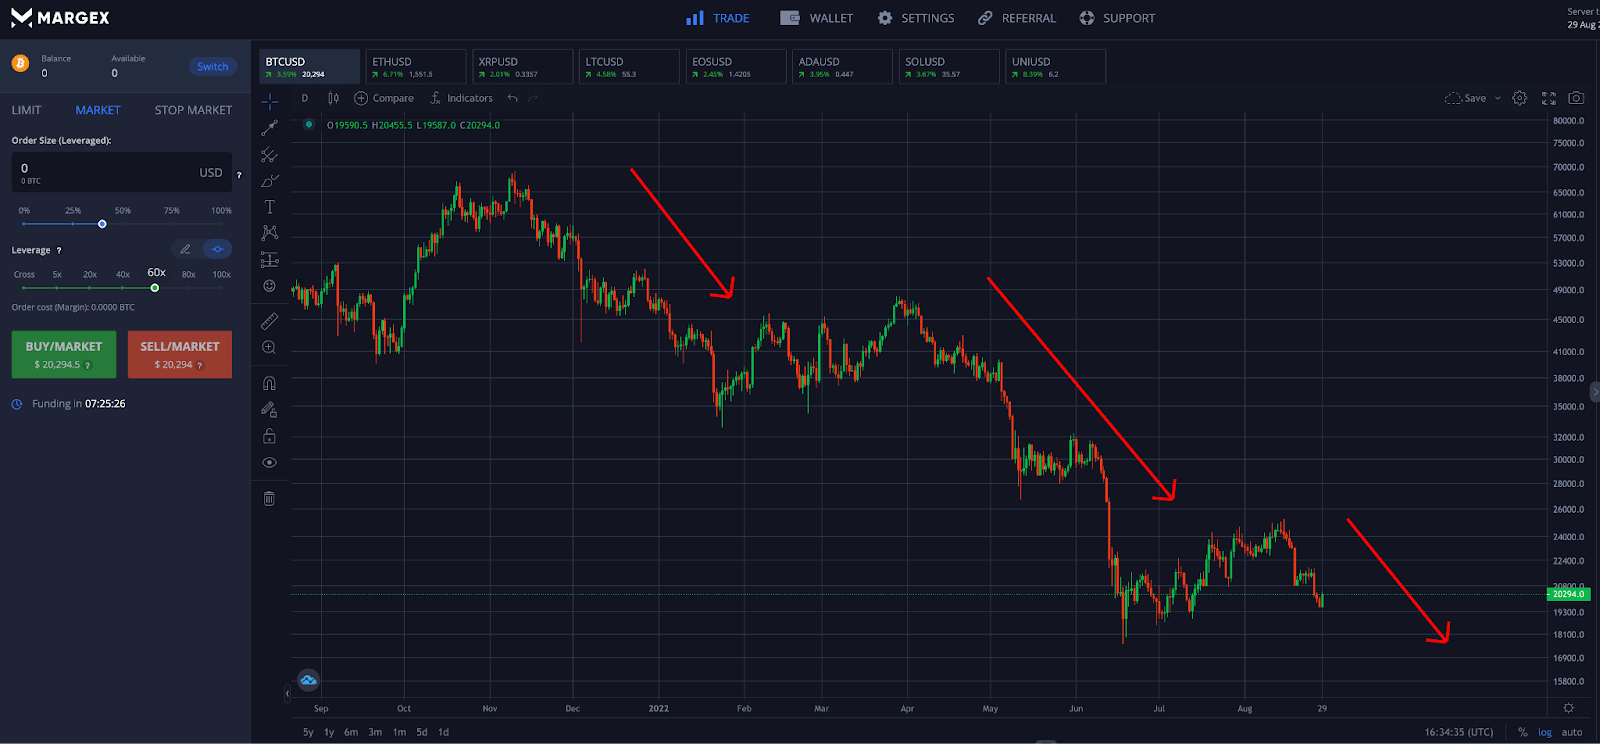
How To Identify A Downtrend? Lower Lows And Lower Highs Patterns
A series of lower-lows and lower-highs is typically an indication of a falling trend. It tells the market that sellers keep stepping in to sell each rally as there is a lot of supply and price resistance and prices have yet to reach a significant point of support or demand. In this type of recurring low trading environment, prices set new lows consecutively for an extended period of time.
A bearish trend in cryptocurrencies can often turn into a crypto winter corrective move where a lot of investors lose money and are better off trading. Crypto winters are an ideal trend for a sell trade. A bear market is also the worst holding period for those who hold spot crypto positions. During market downturns, spot crypto positions can be hedged using crypto hedging strategies.
Countertrend Trading Strategies: Using Higher High And Lower Low Failures To Profit
Trend analysis can also tell traders when it is time to switch to a countertrend strategy. This type of trading strategy trades counter to the trend.
A higher high failure is a signal that an uptrend may be at risk of reversing and prices will soon retrace. Traders should look for supporting signals from technical indicators, such as a bearish divergence, low trading volume, or oversold conditions.
A lower low failure is a signal that a downtrend could be at risk of a reversal after the price of an asset finds support. Once again, crypto traders should look for supporting signals from technical indicators, such as a bullish divergence, low trading volume, or overbought conditions. High trading volume is a sign that a trend could still be strong.
Due to the large number of traders over-expecting a prevailing trend to persist, a sudden trend reversal can lead to an extremely powerful move and profitable trade, After a countertrend trading position is taken, the trader should prepare where they are going to take profit, typically at a previous support or resistance level, or a Fibonacci retracement level.
If a trader cannot determine if the trend is still strong or weakening, it is totally fine to remain market-neutral and wait for more confirmation of the trend direction. Always remember to set a stop loss and backtest trading strategies whenever possible to ensure a high rate of success.
How To Counter Trade A Trend Using Margex Trading Tools: Step-By-Step Guide
Day trading cryptocurrencies is easy using the powerful trading tools and built-in technical analysis software provided by the Margex margin trading platform. The platform also includes access to powerful technical indicators like the Relative Strength Index, Bollinger Bands, Ichimoku Cloud, and the Stochastic RSI.
Using the built-in technical analysis tools provided by Margex, the following steps will walk you through using countertrend trading strategies like a pro:
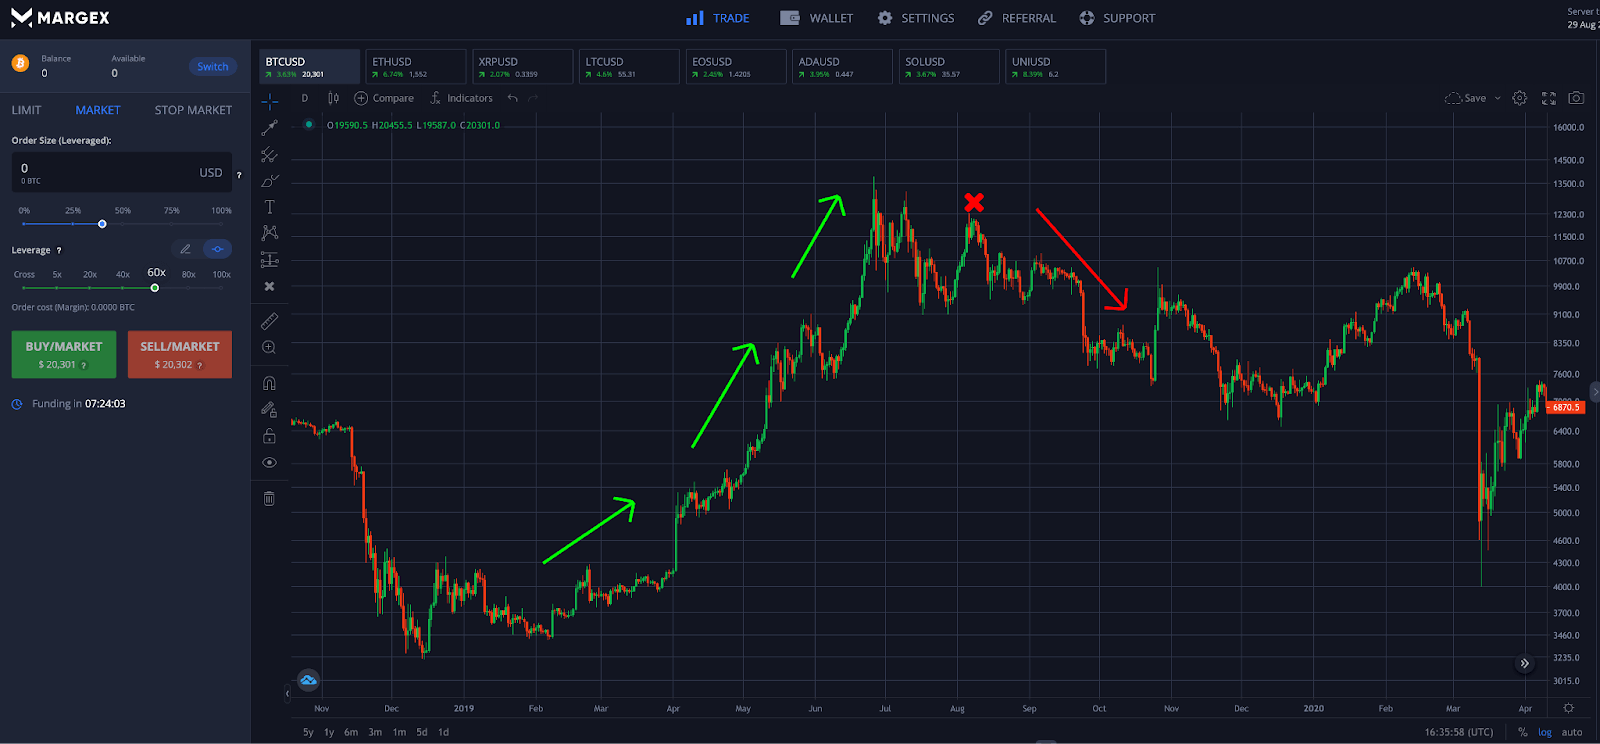
Step 1 – Turn on the Bitcoin (BTC) price chart or another of your favorite cryptocurrencies and scan for potential countertrend activity to anticipate a possible bearish trend reversal.
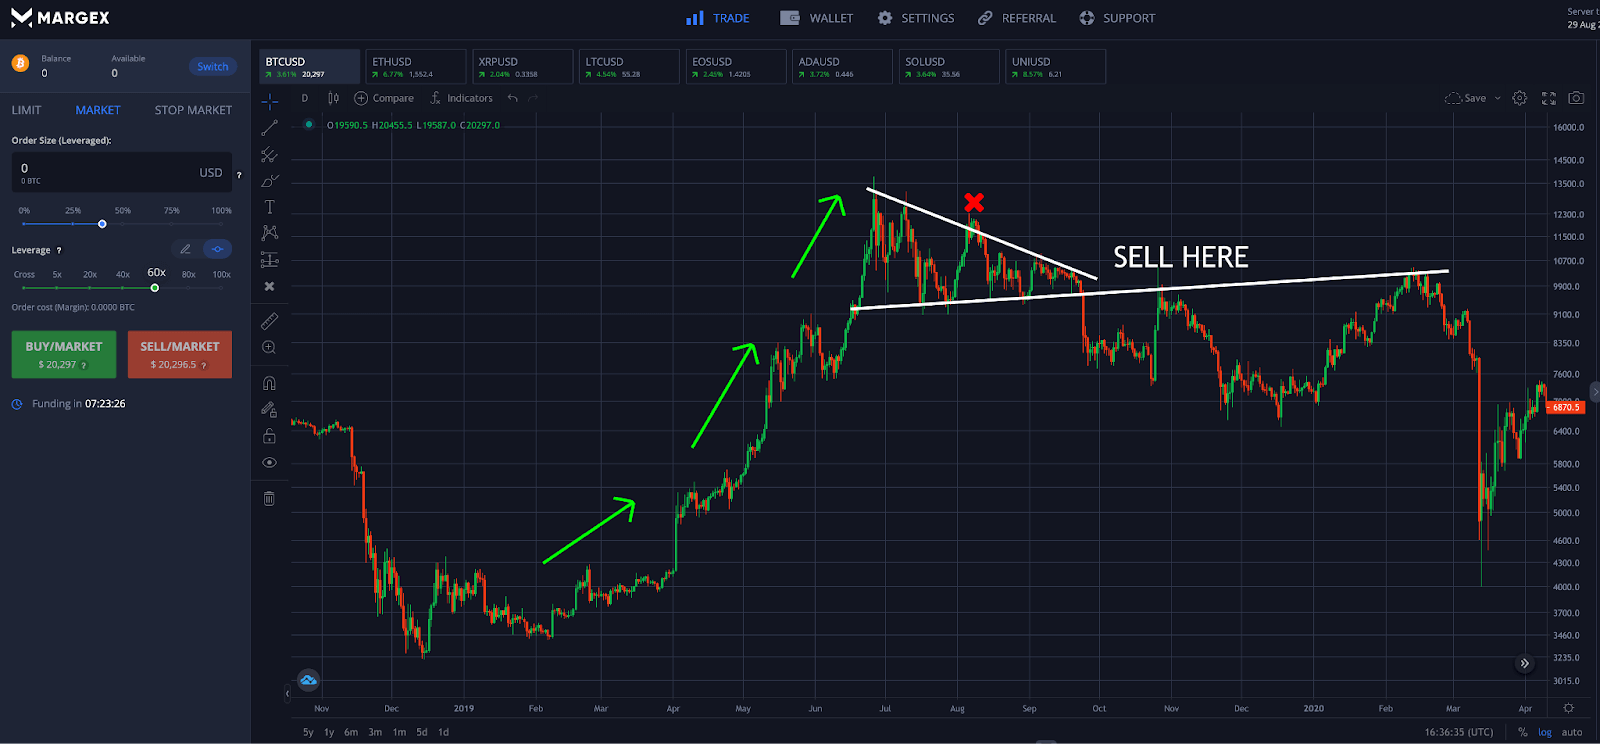
Step 2 – Look for supporting signals such as a bearish divergence or chart patterns, and place a short-sell order when ready to execute a countertrend trade.
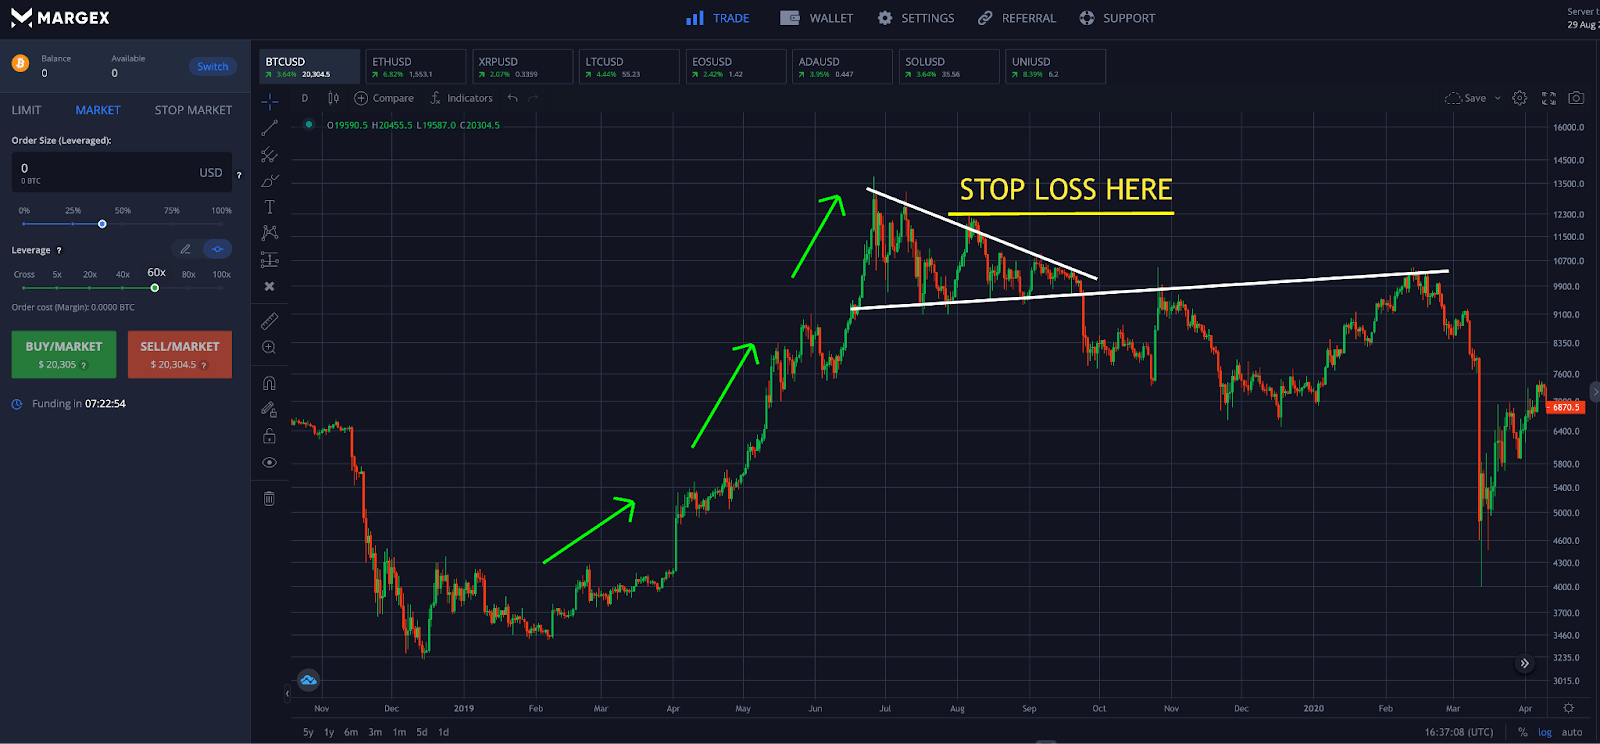
Step 3 – Place a stop loss order above the wick on the top of the recent candlestick forming the swing high. Effective stop loss placement is the key to avoiding losses if the movement of price goes against your position and a trend continues.
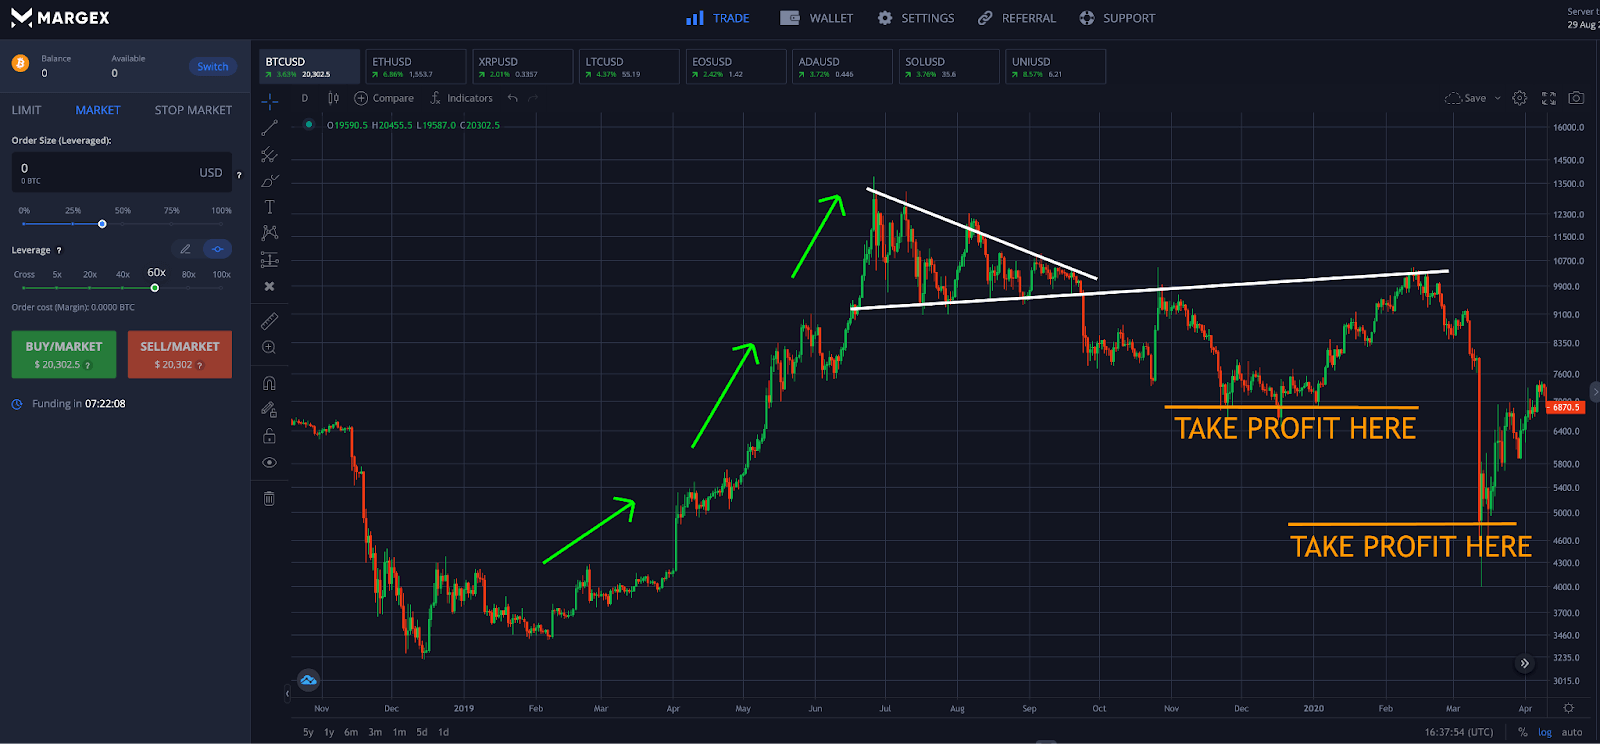
Step 4 – Plan to prepare take profit levels in advance, typically at former support or at a Fibonacci retracement level. Congratulations, you are now a countertrend trader!
FAQ
Understanding trends is among the most important aspects of technical analysis and allows traders to take advantage of the current trend and prepare countertrend trading strategies for when the trend changes.
Here are a list of commonly asked questions related to higher high lower low trading strategies:
What is higher low in candlesticks?
A higher low in candlesticks is typically a sign of a developing uptrend. The idea is that support is building at each pullback and prices continue to move up in a stair-stepping pattern.
What does higher highs lower lows mean?
Higher highs and lower lows refers to the formation of uptrends and downtrends. When prices are uptrending new higher highs are set and higher lows form after each correction. When prices are downtrending new lower lows are set and lower highs form after each failed rally.
Is higher highs and higher lows bullish or bearish? Is a higher low bullish?
Higher highs and higher lows consecutively are a bullish sign that an uptrend is forming or contributing. When this recurring pattern ends, it is a sign the trend is possibly changing and a reversal could follow.
Is lower highs and lower lows bullish or bearish? Is a lower low bearish?
Lower lows and lower highs consecutively are a bearish sign that a downtrend is forming or contributing. When this recurring pattern ends, it is a sign the trend is possibly changing and a reversal could follow.
What does similar highs and lows mean?
When highs and lows are at a similar level a sideways trading range can form. This is usually a sign of consolidation before continuation or another potential sign of a reversal.


