
The crypto market has been gaining popularity the world over during the past decade. It’s every crypto enthusiast’s dream to learn and understand how Japanese candlesticks work and how to analyze them when making investment decisions. As popular technical features in the stock and digital finance markets, they are worth your time. Before investing in crypto, be sure to understand how crypto markets work, and how to predict their volatility by analyzing crypto candlestick patterns.
If you’re a novice in crypto trading, you’re in the right place. This article contains basic details on how to read crypto candlesticks and patterns.
What are Crypto Candlestick Charts?
Candlestick charts are a technical method used to indicate the history of the price of an asset; in this case, a cryptocurrency. They are also popular in forex trading. As the name suggests, they are charts that use Japanese candlesticks rather than the conventional bars to represent the history of price fluctuations within a given period of trade. Trade periods vary and can be one minute, 5 minutes, or a day, to mention just a few.
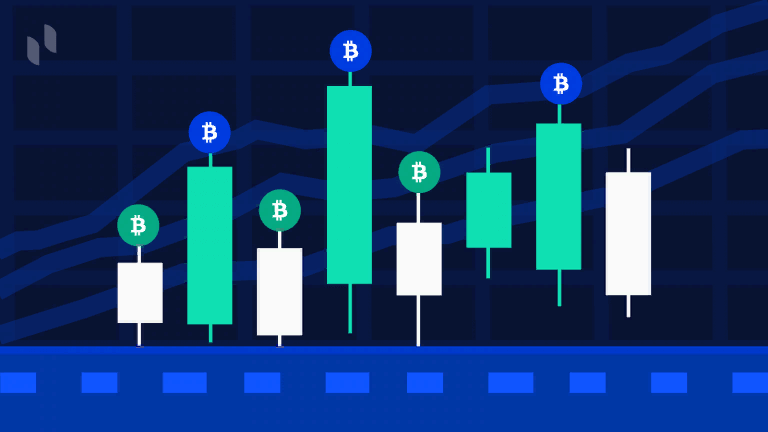
The chart above is an illustration showing the evolution of prices during a certain trading period. The red candlesticks represent periods when the closing price was lower than that of the opening, while the green candlesticks represent the converse.
Candlestick charts are not new: they date back to the 1700s when Homma, a Japanese rice trader, invented them. They have been used to represent the influence emotion has on trading. Crypto traders and other digital traders use the charts to make investment decisions. The candles provide traders with high, low, open, and close prices, which they use to speculate on trade trends. The size and appearance of the candles vary, and each has a meaning. Not to worry, crucial candlestick chart patterns worth noting shall be discussed in the subsequent sections.
What do Crypto Candlesticks Tell Us?

Why not use simple line charts or a bar graph? Crypto candlesticks provide traders with more than just a history of price fluctuations. Experienced crypto traders gauge sentiments in the market using patterns to speculate on the direction of the market and make decisions.
Longtails, for instance, indicates that the value of the crypto is increasing, since more traders buy the asset when the prices fall. A long shadow, on the other hand, signals high sell-off potential, as most traders seek to sell their crypto and make profits. Additionally, short or no wicks may signal strong bullish or bearish trends, depending on the color of the candle.
Based on the trend trade periods form, a trader can decide on when to buy or sell to make profits or avoid losses. All this information may not be available from other simple charts using bars or lines. Viewing the candlestick patterns provides traders with a summary of the price fluctuations during a selected period. As such, the patterns serve as leading indicators that traders can use to make their next move early before other traders flood the market.
How to Read One-Candle Signals
As a beginner, you may be trading for short periods, which means you are more likely to interact with a single candle. If you are interacting with a single candle, here are some of the most common one-candle signals you are more likely to experience:
A Doji candle:
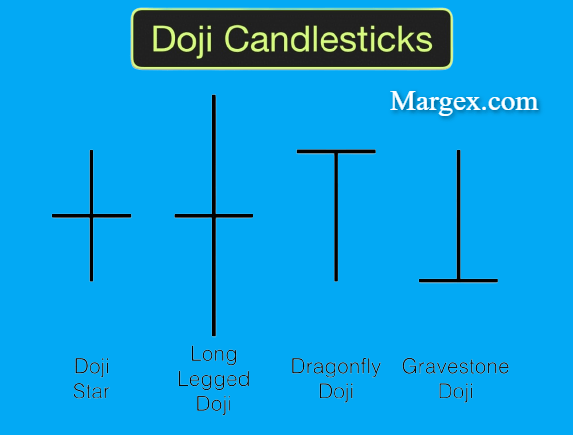
This indicates that the opening and closing prices in the market are still the same. Most traders interpret this as a situation where the market is experiencing indecision. In most cases, the Doji candle indicates an upcoming reversal of prices.
Umbrellas (Hammers and Hanging Men): Both have long tails. The red umbrella is the hammer, which indicates that the crypto might experience a rise in price. The green umbrella, also known as the hanging man, is a signal that the cycle is about to reverse as sellers are willing to cash out.
Tall shadow: A candle with a tall shadow is interpreted as a bearish trend. This means that investors are ready to sell and make a profit. The length of the shadow shows the strength of the indicator.
Tall tail: When a candlestick has a longer lower wick, it means that prices are rising, since investors are seeking to buy crypto. As such, it signals a bullish trend. The size of the tail indicates the reliability of the signal.
How to Read Crypto Candlestick Patterns
Understanding crypto candlestick patterns is key to predicting the trend, momentum, and price direction in the market. As a trader, you’ll experience patterns involving a varying number of candlesticks. It could be one, two, or several. In this section, you will learn how to identify a certain pattern, what it indicates, and the decisions you should make or refrain from making. Here are some of the most common patterns:
Bullish Patterns
Bullish patterns involve green candles and indicate that the opening prices are above the closing ones. There are several forms bullish candlesticks can take, which include:
The hammer:
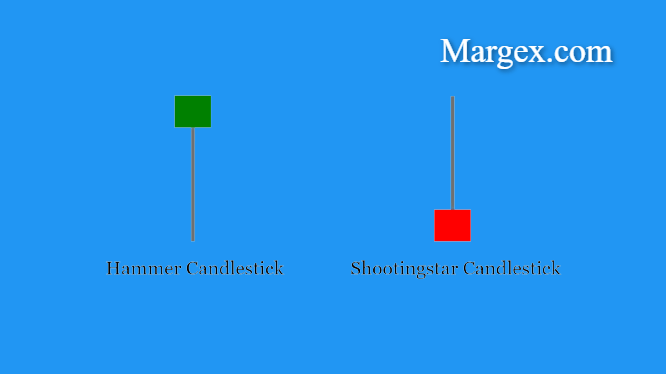
This pattern is easy to spot. It resembles a hammer, which is a candle with a long tail below its downtrend. The hammer might be green or red with a tiny body and a short or no shadow. The hammer indicates a surge in the asset price and a reversal trend. The selling pressure increases, but the buying pressure also rises to retake price action control.
The inverted hammer: This pattern is the converse of the hammer. During this pattern, the potential for an uptrend is high with a flat downtrend, which indicates the potential of buyers gaining control sooner.
Bullish engulfing:
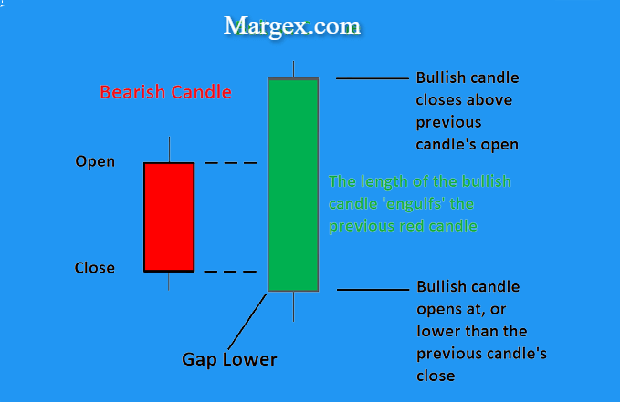
This pattern involves the occurrence of two candlesticks at the base of a downtrend. There is a red candlestick engulfed by a green one which is large, thus covering the bearish candle. This pattern is an indication of a beginning uptrend with increasing pressure in buying. During this trend, the prices are more likely to rise.
Piercing line pattern: In this pattern, the bearish candle is long and is followed by a long bullish one, both at the base of the downtrend. A small gap exists between the opening and closing prices, with the closing price of the bullish candle being halfway above the body of the bearish candle. This pattern indicates the willingness of the bulls to buy assets at the current prices, even though the beginning may seem very bearish. Buying pressure keeps increasing throughout the period.
**Morning star: **This pattern features three contrasting candles at the bottom of its downtrend. The first candle is long and bearish. The second, which is the star, has a short body, long wicks, and closes below the closing price of the previous candle. The third one is bullish and it closes halfway above the first. The star indicates a decreasing previous trend, which is confirmed when the third candle initiates an uptrend.
Three white soldiers: This pattern involves three bullish candles in its downtrend. The second and third candles open along the body of the previous candles, but their prices close above the latter. The candles may have short or no wicks. This pattern indicates a potential reversal in prices as the buying pressure increases, driving the prices up.
Bearish Patterns
Hanging man:
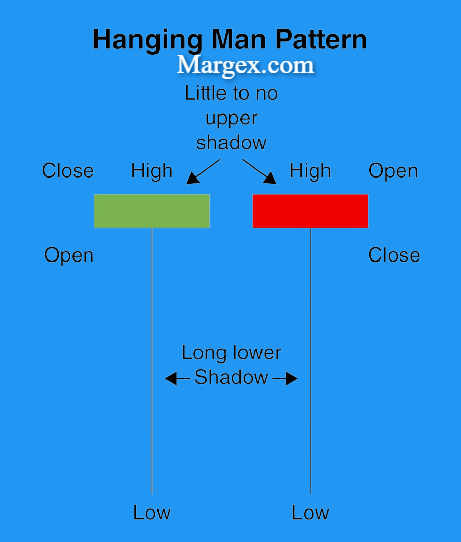
This pattern is the equivalent of the hammer pattern. Its body is small with a long tail and forms at the extremity of an uptrend. The candle can be red or green. The pattern is a sell signal and indicates a weak uptrend.
Shooting star:
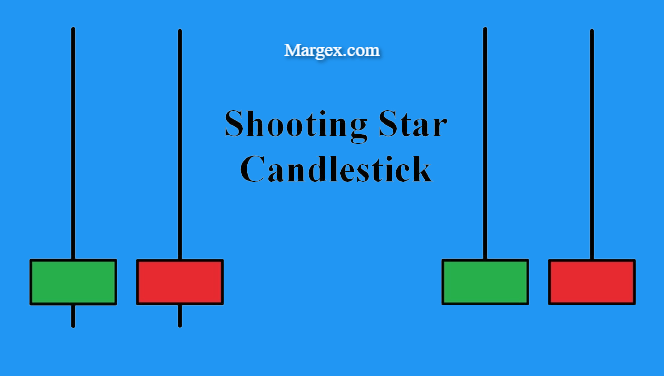
This pattern comprises a candlestick with a long shadow, a short tail, and a small body. It appears on top of an uptrend, unlike the inverted hammer pattern. It often signals a bearish reversal after a price rejection following a recent significant spike in prices.
Evening star:
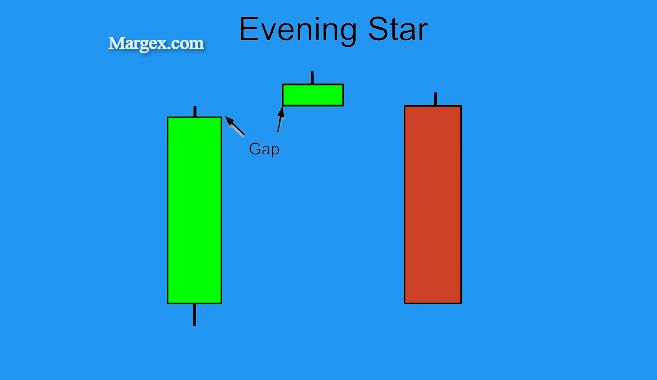
This pattern is the contrast of the bullish pattern, the morning star. Its uptrend consists of three contrasting candles. The first candle is green and long, followed by the star, which has a short body and long wicks. The last one is red, and its closing price occurs below the midpoint of the bullish candle. The evening star indicates a loss of strength in the previous trend, which is confirmed by the third candle, which initiates a downtrend.
Three black crows: The three bearish candlesticks in the uptrend make the pattern recognizable. The third and second candles open within the first candle’s body but close below it. The candlesticks have short or no wicks. This pattern announces a possible price reversal with decreasing prices as a result of the increased selling pressure.
Dark cloud cover: This trend comprises two candles, a green one and a red one. The bearish candle opens above the closing price of the bullish one and closes below its midpoint. This pattern indicates a sell signal, as it marks the end of a previous uptrend and a possible pullback
Candlestick features in Cryptocurrency
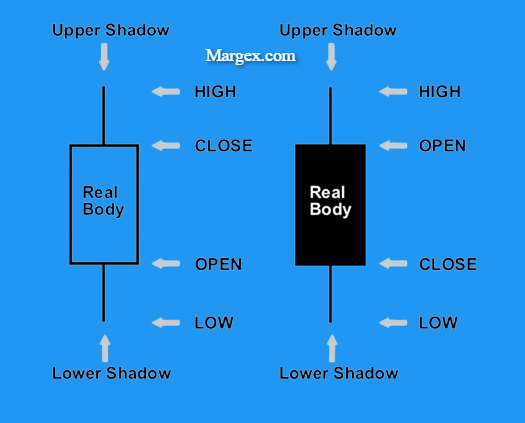
A candlestick provides traders with information on the low, high, opening, and closing prices for a certain period. Every candlestick has parts that vary from one pattern to another. Here are the features of a crypto candlestick:
Wick: The wick indicates the highest or the lowest price of crypto at a given period. It’s a thinner line that extends either on top of the body of the candle or on both sides. The length may vary depending on the market activity. A lack of wicks means the closing and opening market prices were the period’s highest. Additionally, longer wicks indicate the prevalence of the current market prices. Prices in a bearish trend continue to drop and keep rising in bullish trends.
Body: The body is a midsection between the open and the close of a given trading period. The length of the period allows you to set a range for the candles.
Open: Open is the price at the market entry, which is at the top in red candles and at the bottom of green candles.
Close: This is the price at which the period ends. On red candles, it’s at the bottom, and it’s at the top of green candles.
The open and close prices are an indication of the time you ought to buy crypto or stop loss depending on the trend in the market. Understanding how to read and interpret the various patterns stated earlier will help you stop losing and start making profits.
Conclusion
For a crypto trader, learning how to read and interpret candlesticks is crucial. Buying and selling digital assets depends on how well you understand the market trends to decide when to sell or buy to avoid losses. Crypto markets are very volatile, and the secret to making a fortune lies in predicting the trends. To understand the trends, you need more than a candlestick, hence the need to understand various patterns over time. The point in understanding the trends is to help you lead and not lag when making decisions. The catch is in selling or buying before other traders.
FAQ
Why do I need crypto candlesticks?
A candlestick uses four major components to illustrate the price action of an item over a given timeframe: the open, close, high, and low. After a trading period begins, the “open” of a candlestick reflects the price of an asset, while the “close” shows the price when the period ends.
How do I read candlesticks?
The candlestick has a wide part, which is called the “real body.” The real body represents the price range between the open and close of that day’s trading. When the real body is filled in or black, it means the close was lower than the open. If the real body is empty, it means the close was higher than the open.
What do candlesticks mean in crypto?
A candlestick chart is a way of displaying the past prices of an asset (such as crypto) in order to provide a good summary of the price’s history. Candlestick patterns can signify bullish or bearish reversals in Bitcoin and other cryptocurrency trading.
Do candlestick patterns work in crypto?
Candlestick patterns provide cryptocurrency traders with a clearer picture of what is likely to happen next. In other words, they serve as trading signals, advising traders on when to enter long or short positions, as well as when to abandon the market.
A trader’s whole trading activity takes place on the Trade page, which is also known as the Trading Terminal on the Margex exchange. You’ll be able to watch the market using Charts (in candlestick format), place and manage Orders and Positions, and see a comprehensive history of your Orders and Positions here.
Traders can check details of their order/deal history, monitor the market, place and manage orders, control open deals, and monitor the market.


