
Technical analysis for traders involves merely trading the chart hoping for the trade to go in your favor or trading the news with the belief you will come out profitable. Strategies such as these tend not to work in the financial market as it involves more psychology and finding a trading edge to profit, maintain proper risk management and stay profitable constantly.
Profitable traders believe that having a trading edge, the right psychology, and a strategy distinguishes you from new traders in the cryptocurrency space. This skill can be very useful for traders, especially during a bearish run, when there appears to be little liquidity to trade and a good technical background is required to profit consistently.
One of the ways that traders stay ahead of the market with an edge to profit from market trends is through strategies, chart patterns, indicators, oscillators, and price actions.
Most traders who trade the market consistently try to find the best profitable strategy for trading; this involves identifying trend shifts from bearish to bullish, combining candlesticks or candle patterns to stay profitable and manage risk accordingly.

In this guide, we will look at how traders can identify candle patterns such as the pin bar candle pattern, one of the many most powerful technical analysis candlestick patterns used to determine trend reversal. Traders use the pin bar candlestick pattern to identify early trends or trend reversals in the financial markets.
What Is A Candlestick
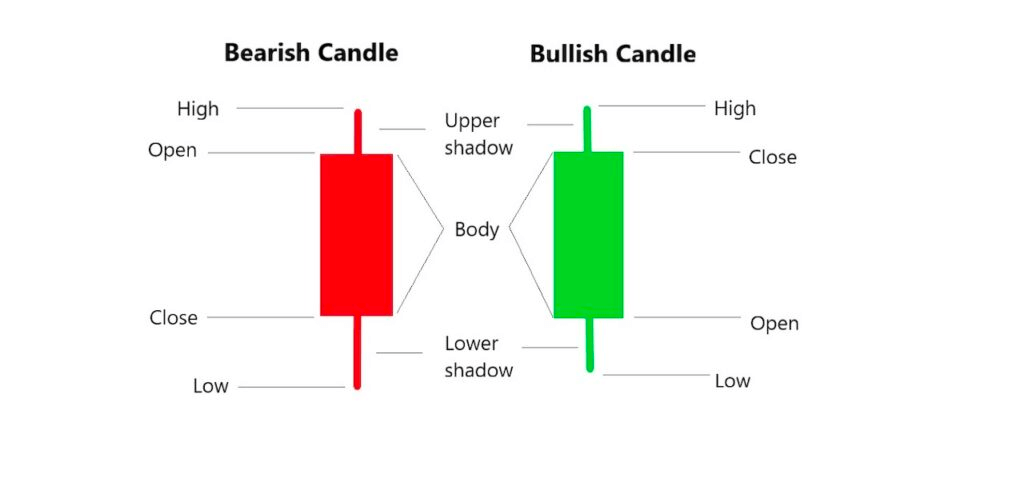
A price chart used in technical analysis by traders to determine the market’s opening, closing, high, and low prices based on different timeframes is known as a candlestick.
The candle, or candlestick as most traders would call it, was introduced by Japanese rice traders to track the price of their assets. There is more attached to the candlesticks as it gives us a pictorial representation of the sentiments and motives of investors and traders towards an asset regarding prices.
There are two common types of candles, bullish and bearish candlesticks. Candlesticks are made up of the body and wicks or shadows. In some cases, candles do not have shadows like the Marubozu candlestick, and some with no bodies like the Doji candlesticks.
For a bullish candlestick (green/white), the closing price is higher than the opening price, while for a bearish candlestick (red/black), the opening price is higher than the closing price.
What Is The Pin Bar Candlestick Pattern?
The pin bar candlestick pattern is a small-bodied candle with long upper or lower wicks (Shadows) used in technical analysis by traders to spot weakness in a particular trend with a possible trend reversal. Sometimes this candlestick appears between a bullish and bearish candlestick indicating a bullish or bearish pattern.
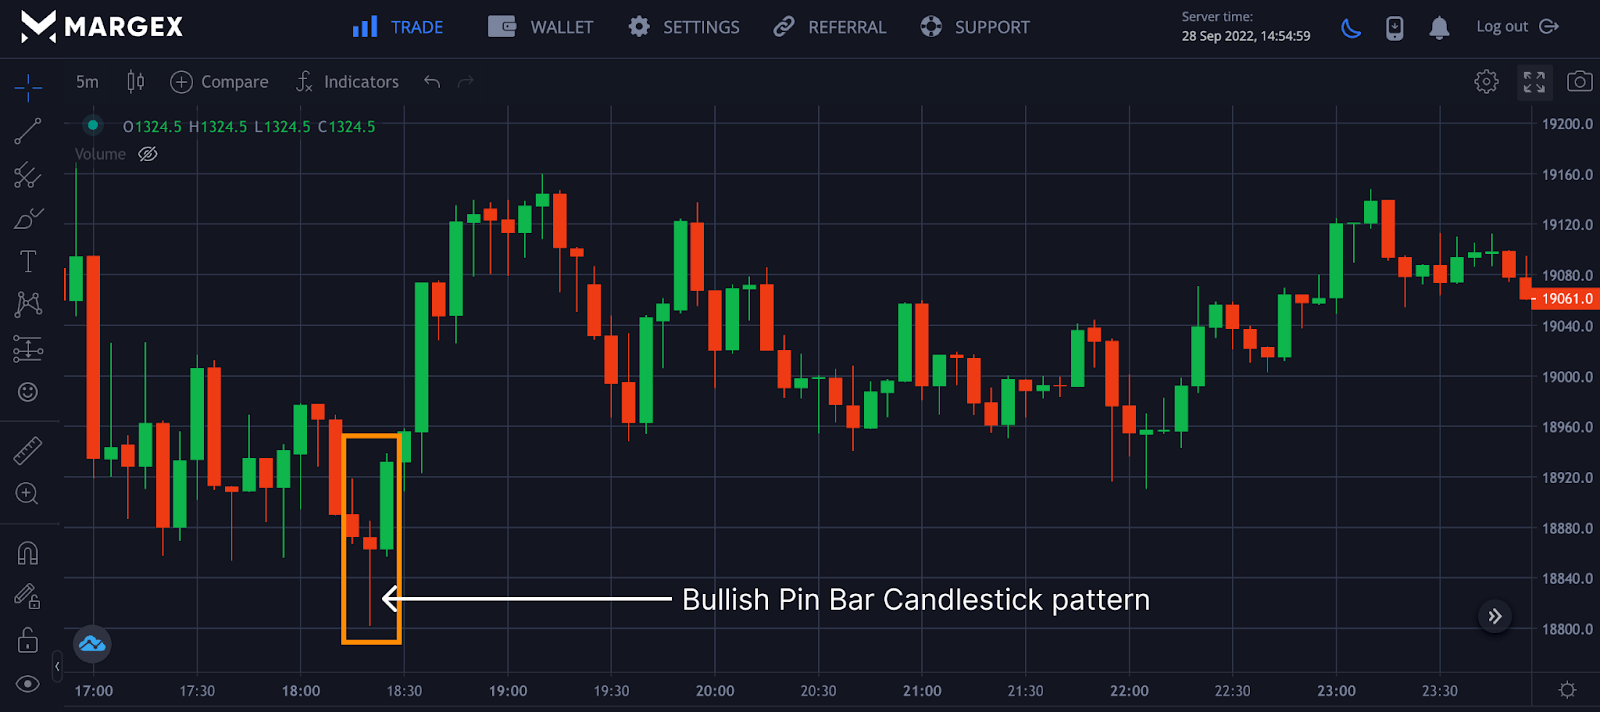
The chart above shows a bullish pin bar candlestick pattern; after the formation of this pattern, the price of the BTCUSD pair rallied as buyers took control of the market prices.
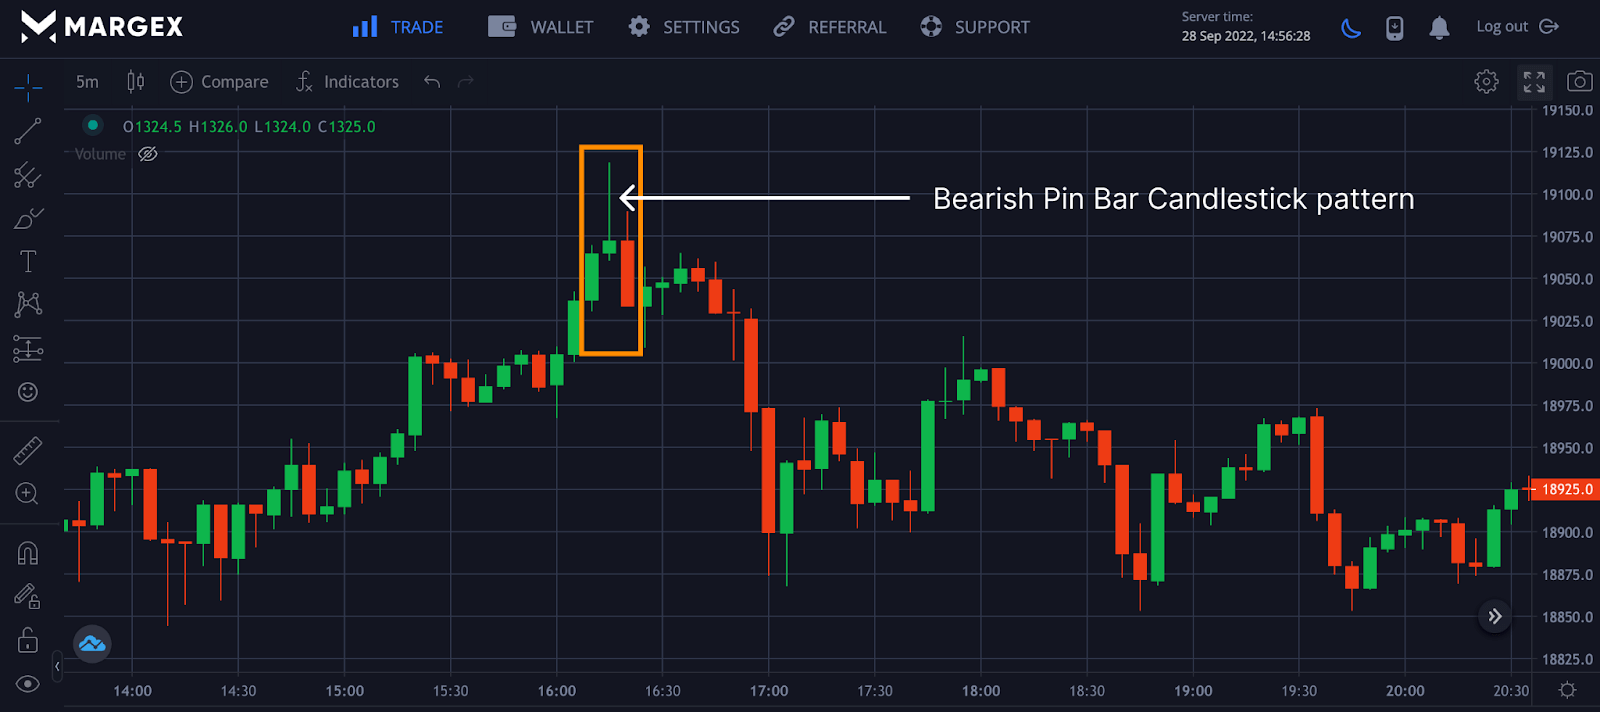
The chart above shows a bearish pin bar candlestick pattern for the price of BTCUSD as the seller overpowered the buyer’s driving price in a downtrend. When combined with other strategies, a pin bar candle can be very helpful for spotting price reversals and entering a trade with high-profit potential.
The pin bar candlestick is one of the easiest candles to spot for most traders as it can be visually seen during price rejection either in an uptrend or downtrend. It is important to note that sometimes double pin bars can be formed for either bullish or bearish price reversals.
The Pin Bar Setup
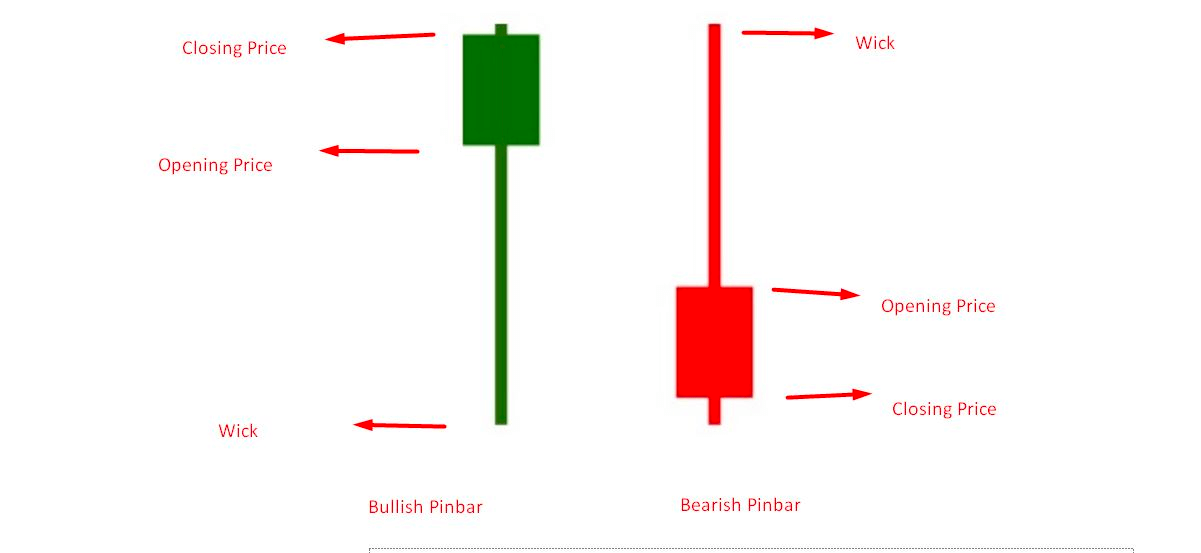
The pin bar candlestick is one of the most common candle patterns you can find as a trader because of how simple its structure is. The image above shows the various set up of the pin bar candlestick pattern. The pin bar candlestick pattern comprises a small body, a long wick or shadow, an opening price, and a closing price.
Most traders describe the pin bar candlestick pattern as needlelike because of its long wick. The wick appears top and bottom of the candlestick, with one of the wicks looking longer than the other.
The pin bar candlestick pattern is usually tradable at the end of a downtrend, indicating a potential price reversal for a bullish pin bar candle pattern. For a potential downtrend, the pin ar appears at the end of an uptrend indicating exhaustion as a downtrend reversal could be imminent. Traders who spot the pin bar formation due to price action prepare to counter the trend, as reversal could begin soon.
Pin bar candlestick pattern could be assumed to be a rejection as traders prepare to sell their assets. Sometimes pin bar pattern formation can be seen as demand zones or levels as prices bounce off from those levels rallying to higher regions.
A pin bar candlestick pattern could be a bullish pin bar candlestick pattern or a bearish pin bar candlestick pattern.
Bullish Pin Bar
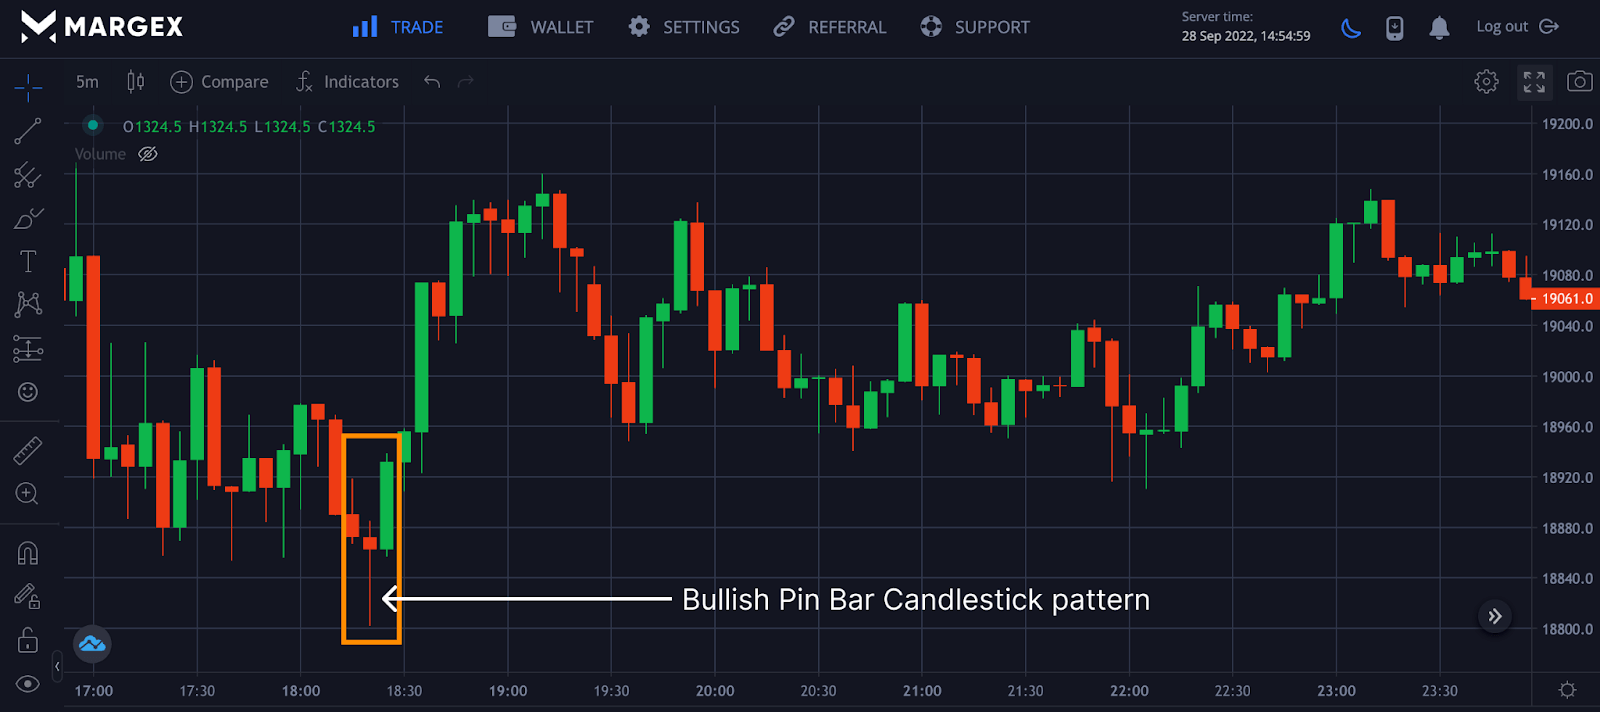
The bullish pin bar usually appears after a bearish trend signaling a potential change in trend as buyers have overpowered the sellers. The bullish pin bar comprises a small body with a lower long wick. Traders usually trade this pattern by opening a long position for a crypto asset. The image above shows a bullish pin bar with a change in trend from a downtrend to an uptrend.
Bearish Pin Bar
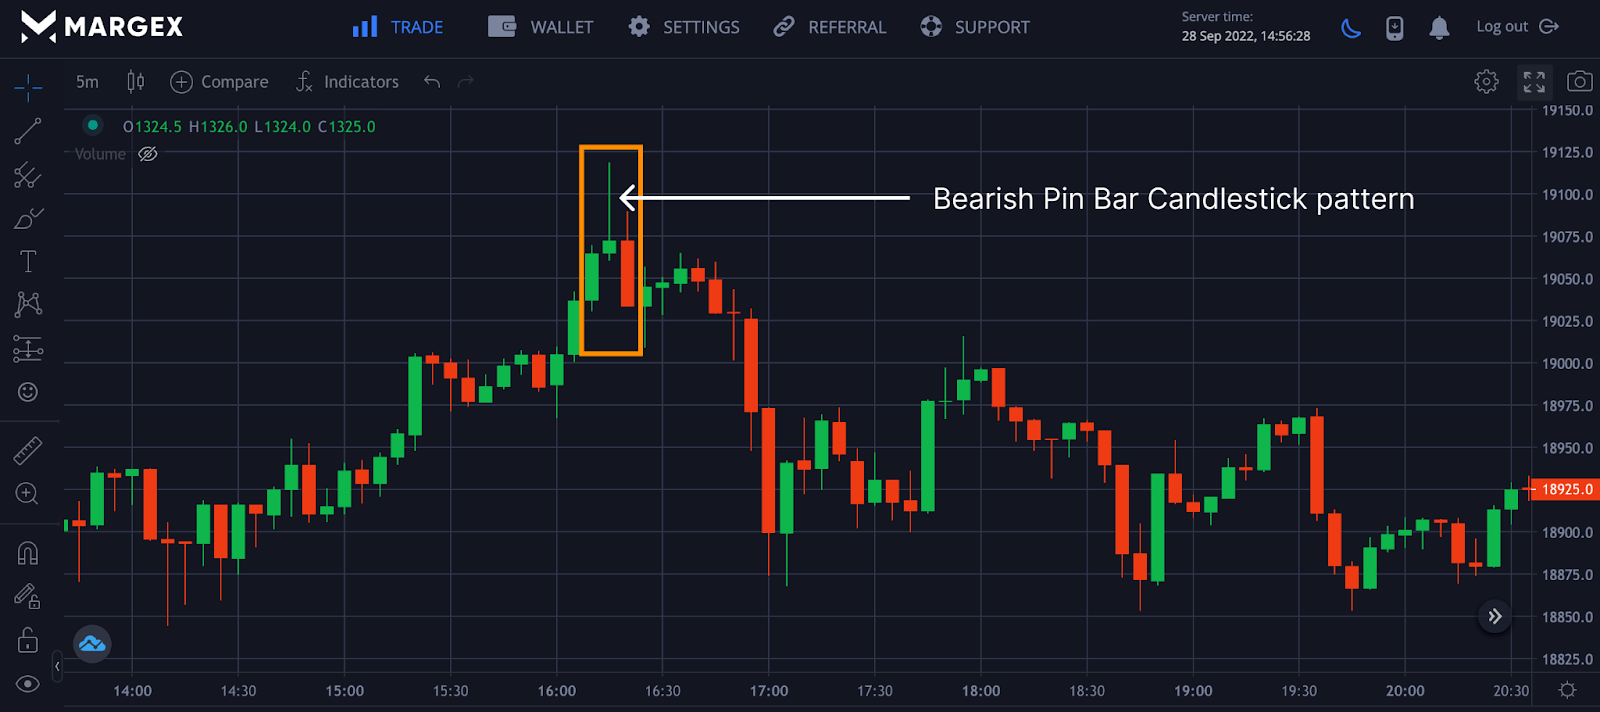
The same is true for a bearish pin bar signaling a potential price reversal as sellers have overpowered the buyers with price exhaustion. The bearish pin bar has a long wick or shadow located at the upper part of the body due to the price actions of the sellers.
Pin Bar Chart Examples
Trading the bin bars requires extreme caution as they can produce false signals if not properly used. Traders should look for long candle wicks formed as a result of price actions from either the buyers or sellers. It is key to note that pin bars can be formed when an asset consolidates before trend continuation; traders need to take note of this structure to avoid being unaware. Traders should avoid pin bars that occur during price consolidation.
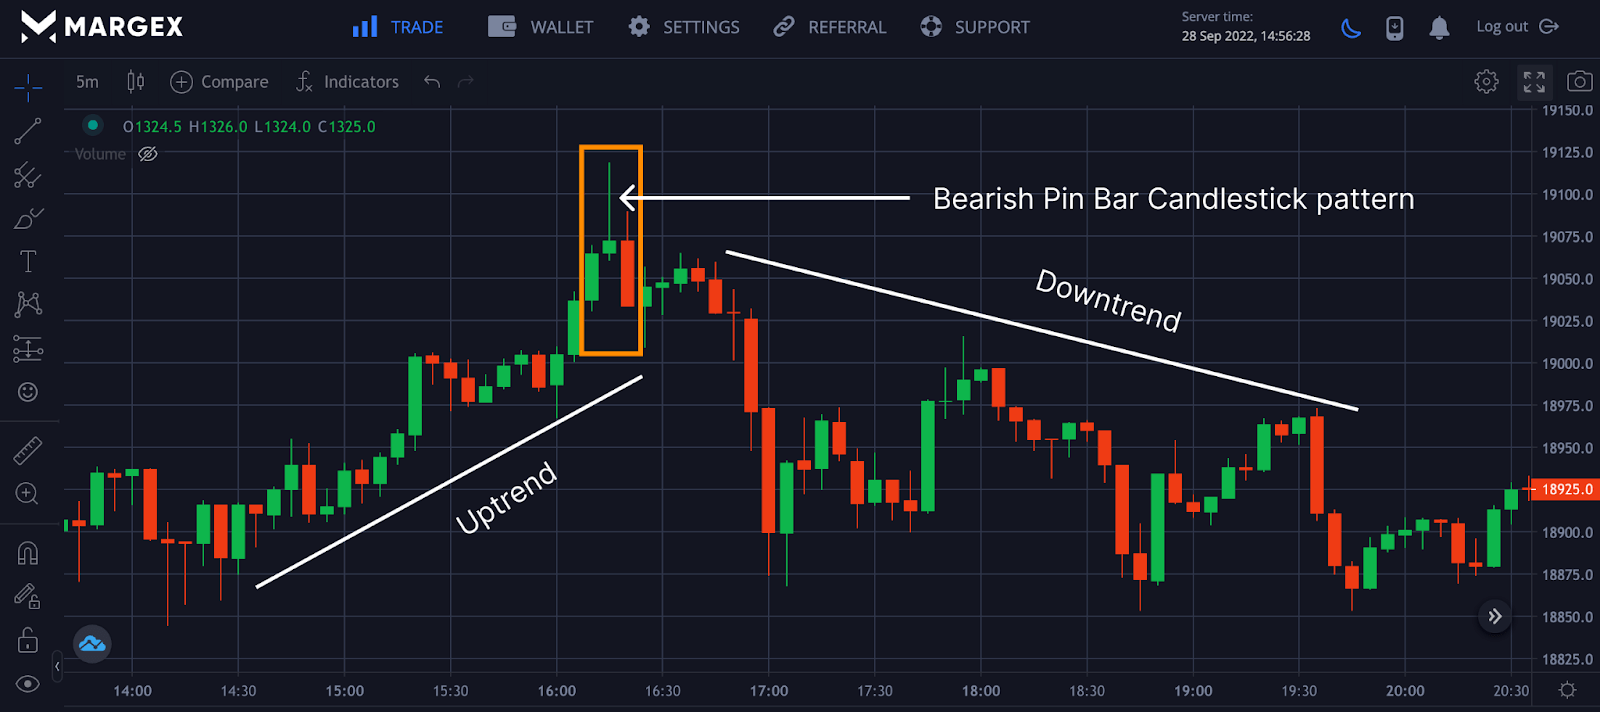
From the chart above, the price of the BTCUSD pair maintained a bullish structure, but the price was soon exhausted as sellers aimed to take control of the market through price action. The formation of a bearish pin bar candlestick pattern confirms the could be headed for a potential reversal with the price initiating a downtrend.
A trader on confirmation that the price looks exhausted with the formation of a bearish pin bar candle could open a short position as this could have presented a good opportunity for profitability.
You must have noticed that the pin bar candle pattern wants to look like the hammer and shooting star pattern; we would discuss that and conclude that they are a variation of the pin bar candle.

Pin Bar Types
Pin bars come in different variations; let us discuss the various pin bar types and how to identify them from the most common type, the bullish pin bar, and the bearish pin bar.
Hammer
There are many pin bars with the Hammer pattern, also seen as a type of pin bar for technical analysis. Let us look at what makes the Hammer pattern slightly different from the regular pin bar, although Hammer is a type of pin bar.
The pin bar and Hammer candlestick pattern are the same structure and purpose for identifying trend reversals. The only difference between a bar and Hammer is their names, as they both work and look the same way they have been brought. The Hammer is a bullish candlestick reversal pattern that works similarly to the bullish pin bar candlestick pattern.
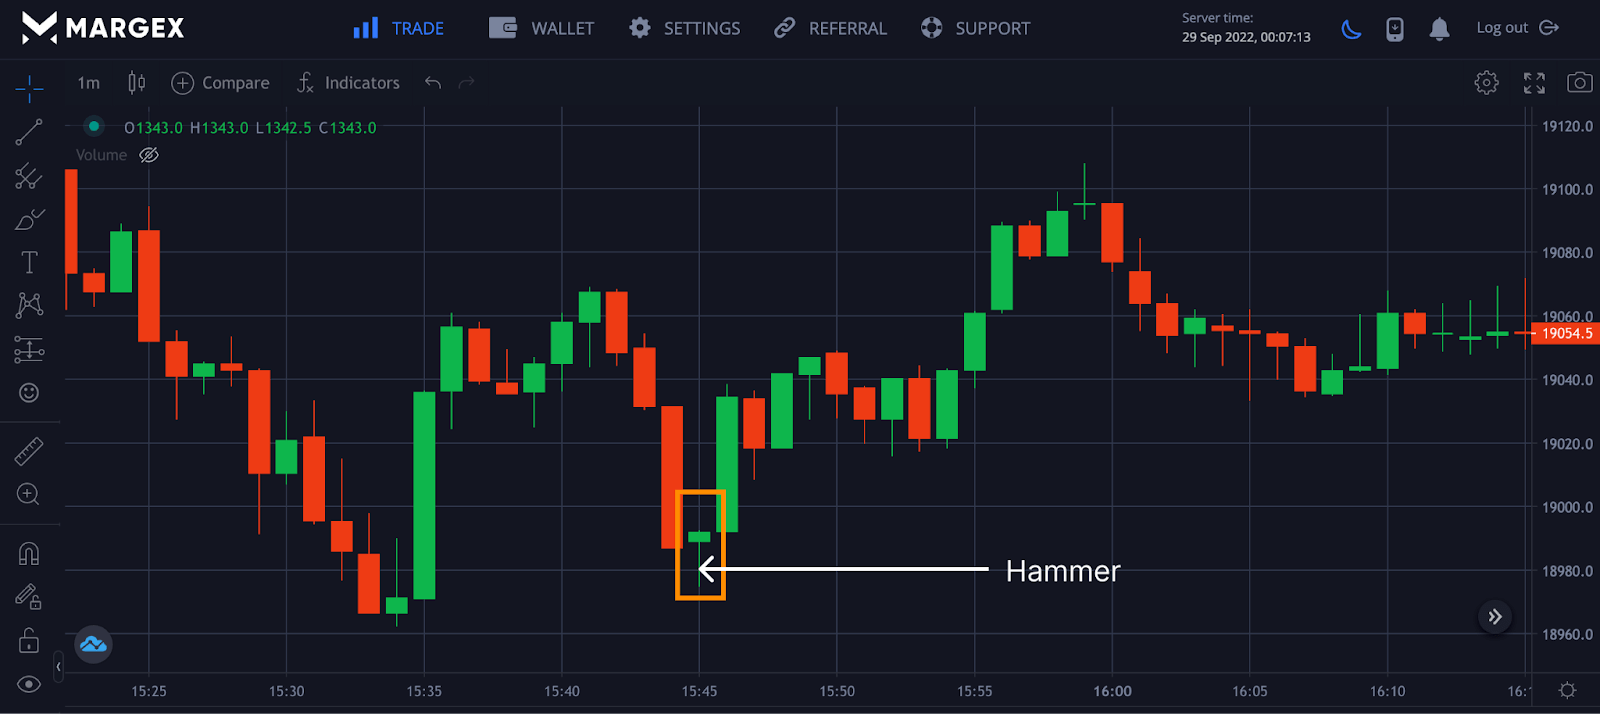
The chart above shows the formation of the Hammer, indicating price reversal from bearish to bullish with a confirmation of an uptrend.
Shooting Star
Another type of pin bar candle pattern is the shooting star bearish candle with a long, small body and little or no upper wick. This appears at the end of a trend to signal the end of the bullish run, as the price could be heading bearish in a short time.
Sellers form shooting star to indicate a potential trend reversal as the sellers have overcome the buyers with price shifting from an advancing stage to a downtrend.
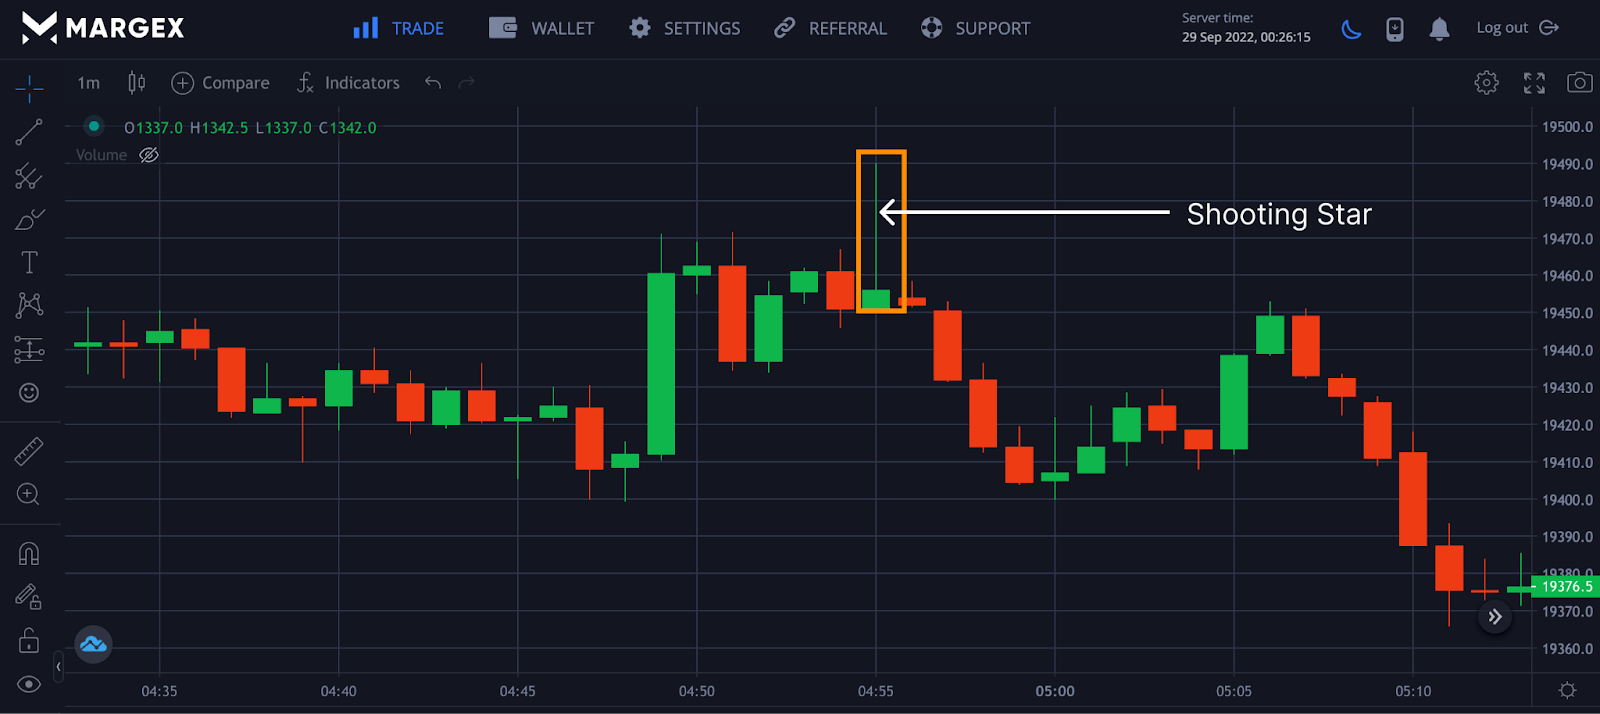
The formation of the shooting star led to price retracing as the market was overwhelmed by sellers leading to a sharp decline in price.
Inverted Hammer
A Japanese candlestick pattern used to spot trend reversal is the inverted Hammer. The inverted Hammer usually appears at the end of a downtrend, giving the traders an indication that a trend reversal is imminent.
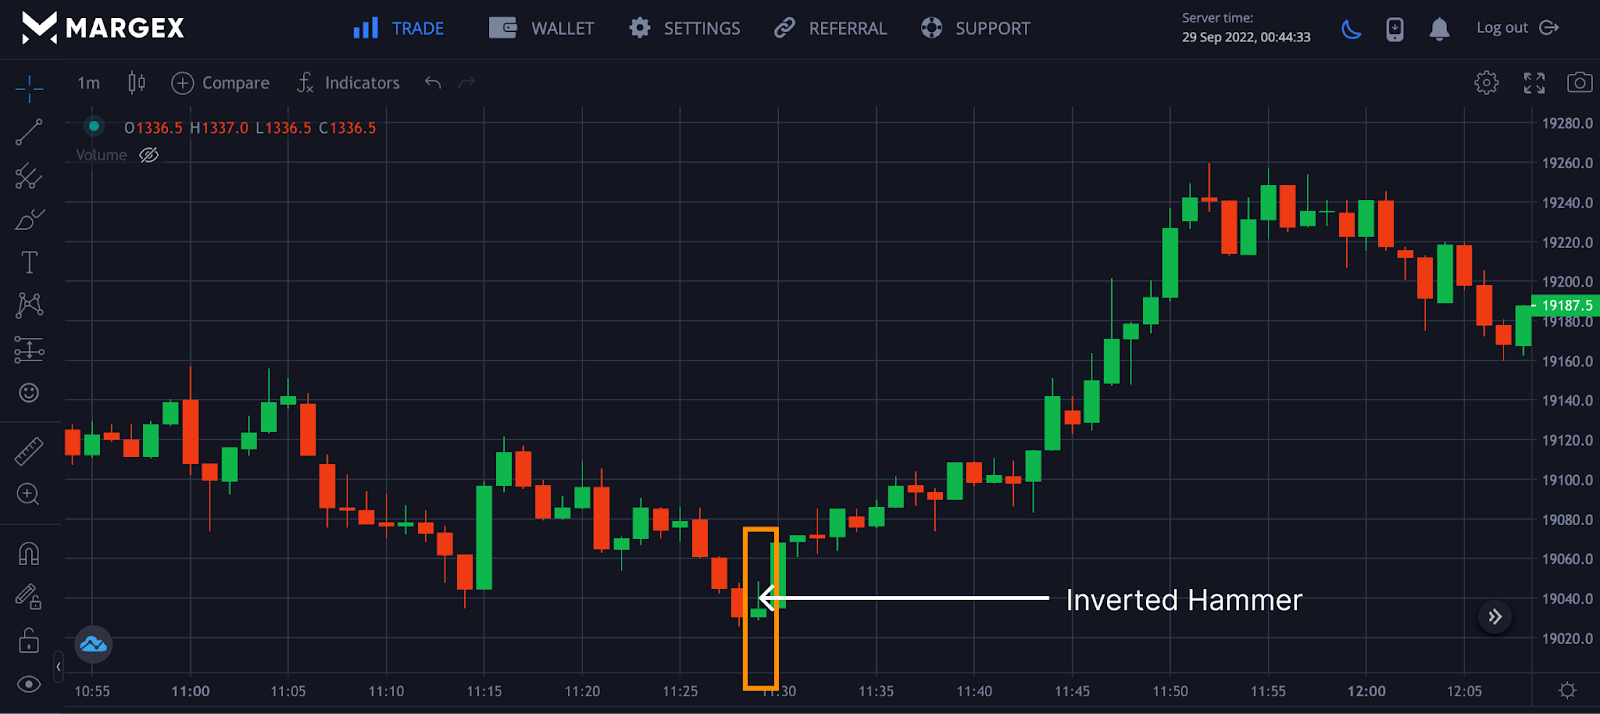
The appearance of the inverted hammer signaled a potential price change from a downtrend to an uptrend. The Inverted hammer should not be traded alone for better and more efficient results.
Hanging Man
The hanging man belongs to the single-candle formation, and this pattern appears a the top of an uptrend with a potential price reversal to the downside.
The reversal does not start on formation and confirmation by the trader; rather, it indicates the price coming to a potential end due to its price action.
Trading the Hanging man without proper knowledge would be misleading as this could produce false signals trading this strategy alone.
How To Trade Pin Bars On Margex?
Margex is a bitcoin-based derivatives platform that enables traders to trade up to 100x leverage size, and at the same time, you can stake your tradable tokens to earn money on both sides. Margex trade and stake features are the first in the crypto space and a unique feature allowing both advance and beginner traders to earn up to 13% APY with just a few clicks.
Staking does not have lockup periods, and staking rewards are withdrawn to staking balances daily with the help of the Margex automated system. Margex has been built to be the best exchange regarding user experience and security regarding the staking and transactions carried out on the Margex platform.
Open a Margex account, and if you are an existing user, you can log in to access all of Margex’s features, including free trading tools.
Margex’s unique user interface makes it simple for even inexperienced traders to trade and use technical analysis tools to identify trend reversal patterns, such as the pin bar candle pattern.
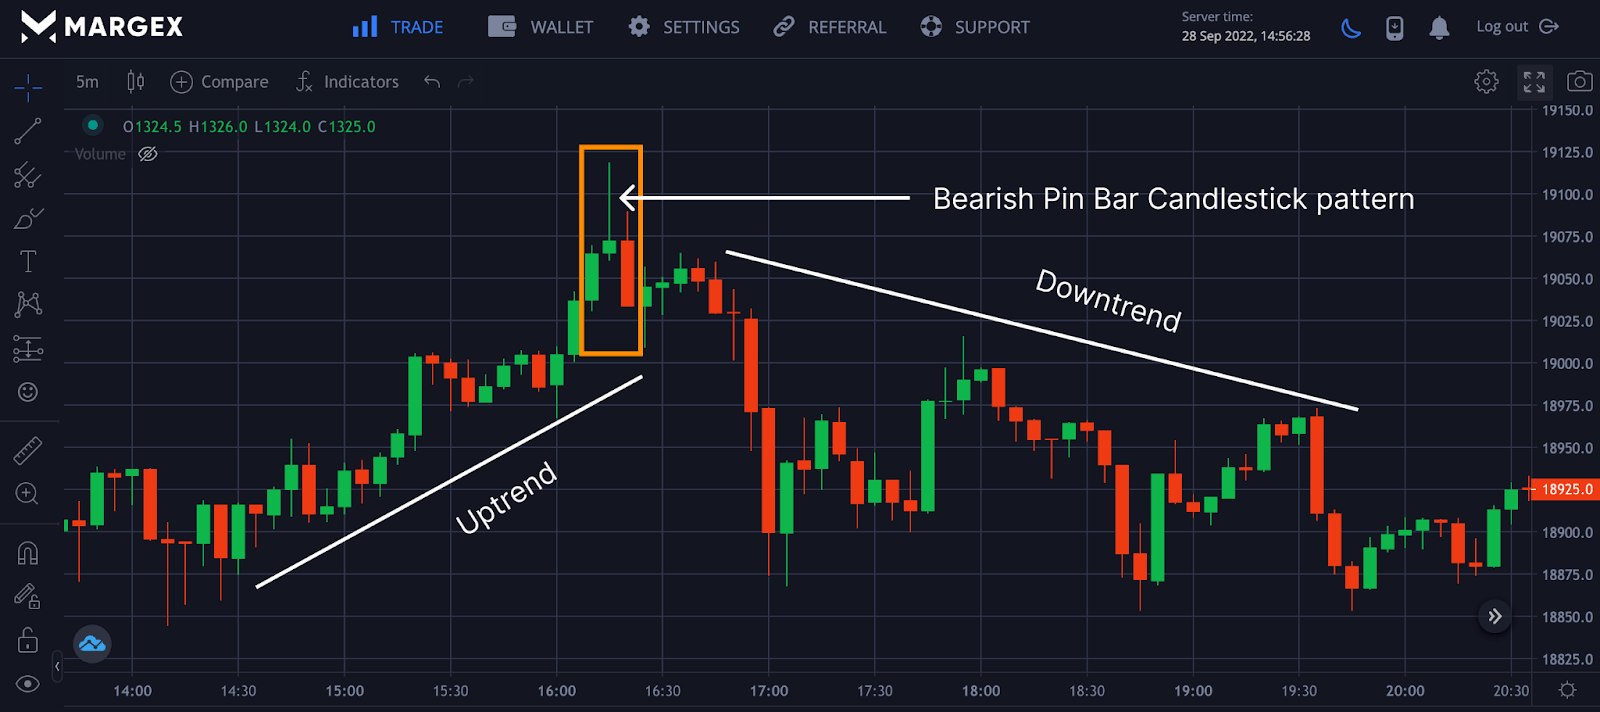
Having an account on Margex allows you to trade all the patterns we have discussed. The trade section of the Margex exchange gives you access to charts and real-time prices to put your skill into use. Let us see how to trade this bearish pin bar candle using the BTCUSD pair on Margex.
From the chart above, the bearish pin bar candle appears in an advancing stage of a crypto asset showing signs of weakness and exhaustion, with a change in trend confirming the formation of the bearish pin bar pattern.
Pin Bar Trading Strategies
Trading the pin bar candle is one of the mistakes many traders and inexperienced traders make. The pin bar candle can be exploited in times of extreme volatility and price action that comes with the market. Pin bar candles can produce false signals when microeconomic events and breaking news affect the market positively or negatively. The best way to trade the pin bar candle pattern is with other tested strategies. Let us discuss a few of them.
50% Retracements
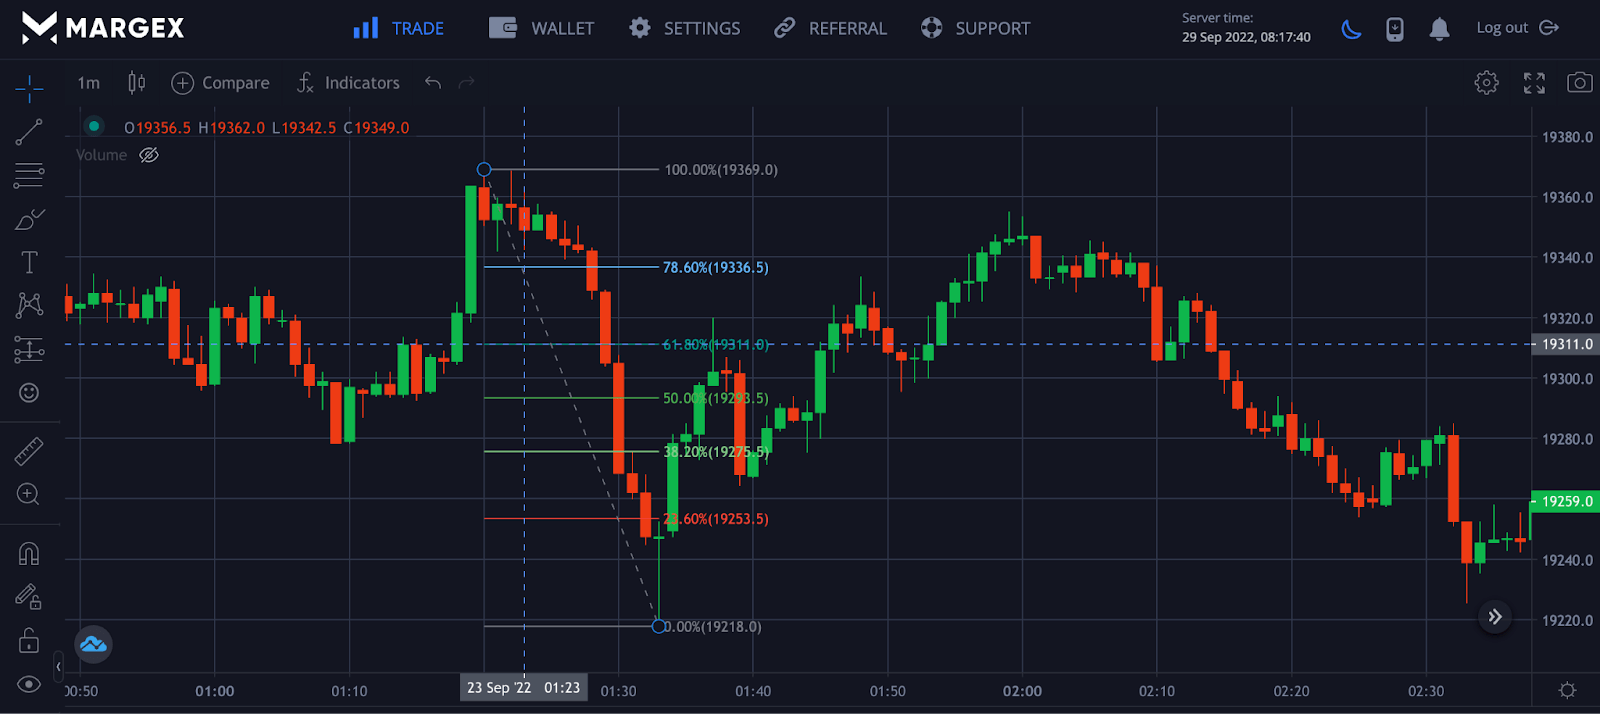
Using the Fibonacci retracement levels is a good way of confirming entries and exits of trades’ entries. Combining the Fib values with the pin bar candle pattern is a good strategy for a better risk-to-reward ratio. From the image above, the pin bar candle indicated a possible trend reversal from bearish to bullish. To confirm this, the Fib value was used from a swing low to the next swing high. A breakout above the 23.6% value confirmed a trend reversal, and a trader could look to enter a long position with price breaking above the 38.2% with stop loss set below the value and a take profit of 61.8%.
VWAP Bounce
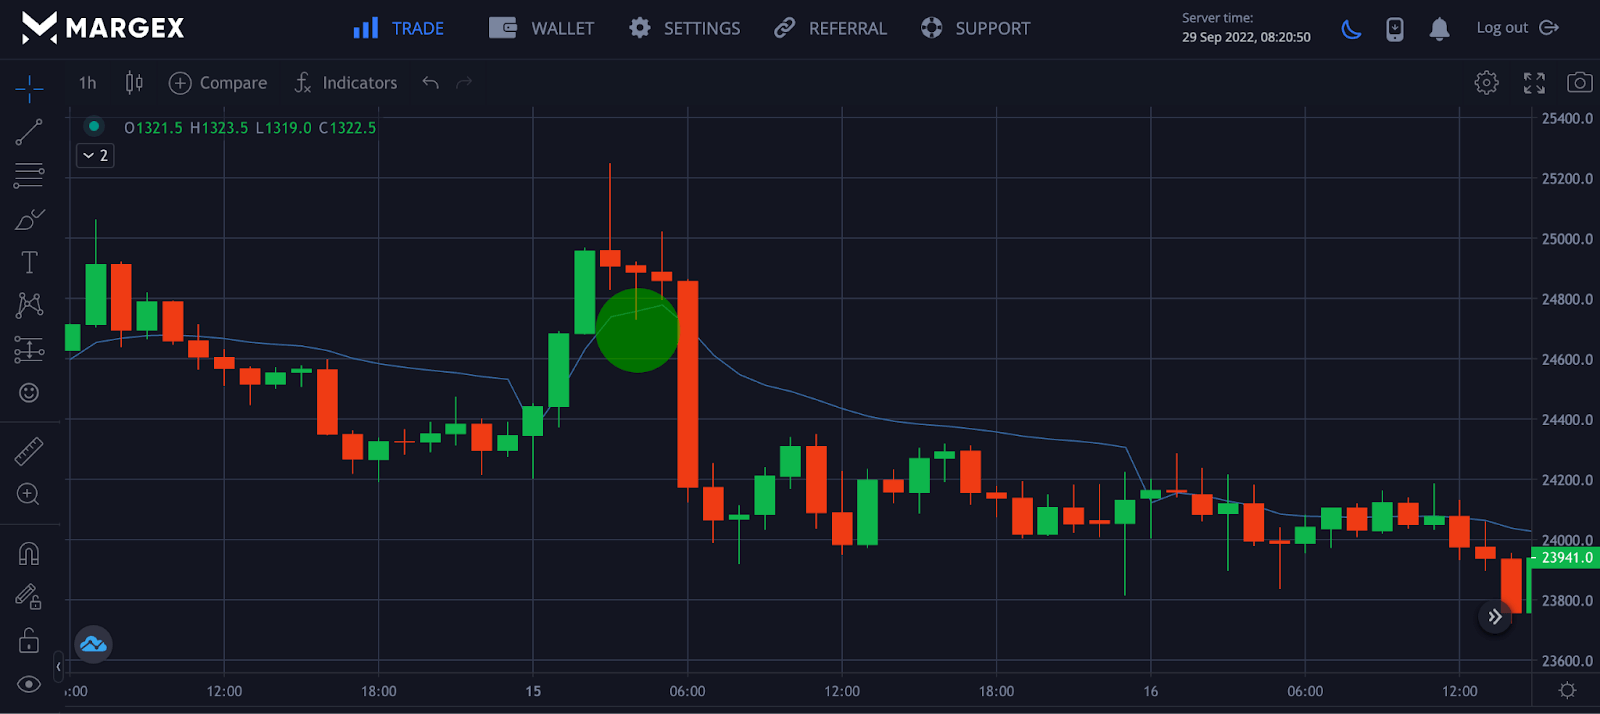
The VWAP bounce is another good way of confirming the trend reversals. From the chart above, the uptrend movement was accompanied by a Hanging man, indicating a possible trend change. The change in trend was confirmed by a VWAP bounce followed by a decline in price.
Moving Average Bounce
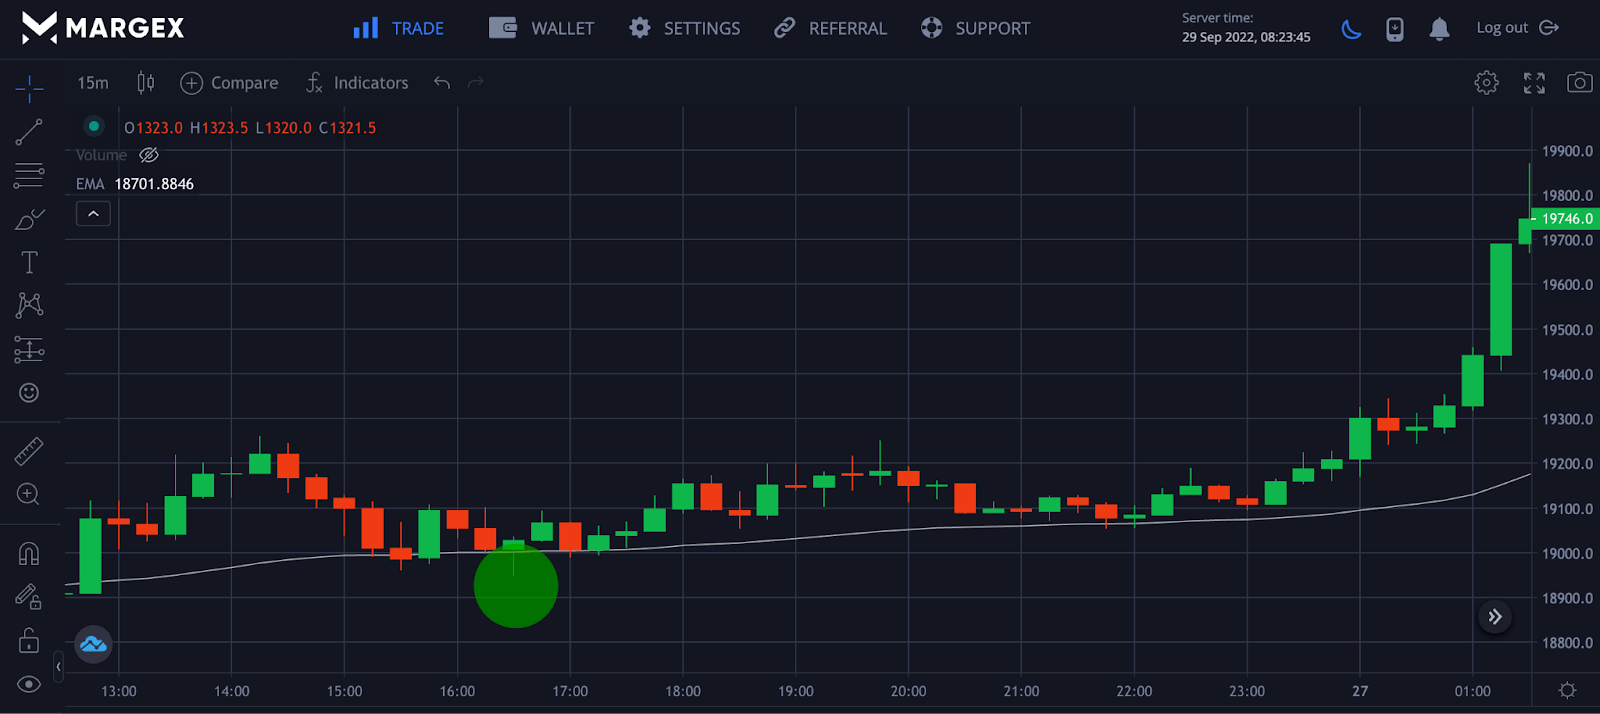
The Hammer is a strong bullish reversal pattern traded by many traders and confirms the trend reversal from a downtrend to an uptrend. The use of a 50 exponential moving average confirms the correct trend in the market. It is best for all traders to trade with the trend and not against it; as many would always say, “the trend is your friend.” Trading against the trend would lead to loss of capital and extreme exposure to risk. The bounce of price on the 50 EMA and the formation of a hammer confirms a trend reversal to the upside.
Double Bottom Strategy
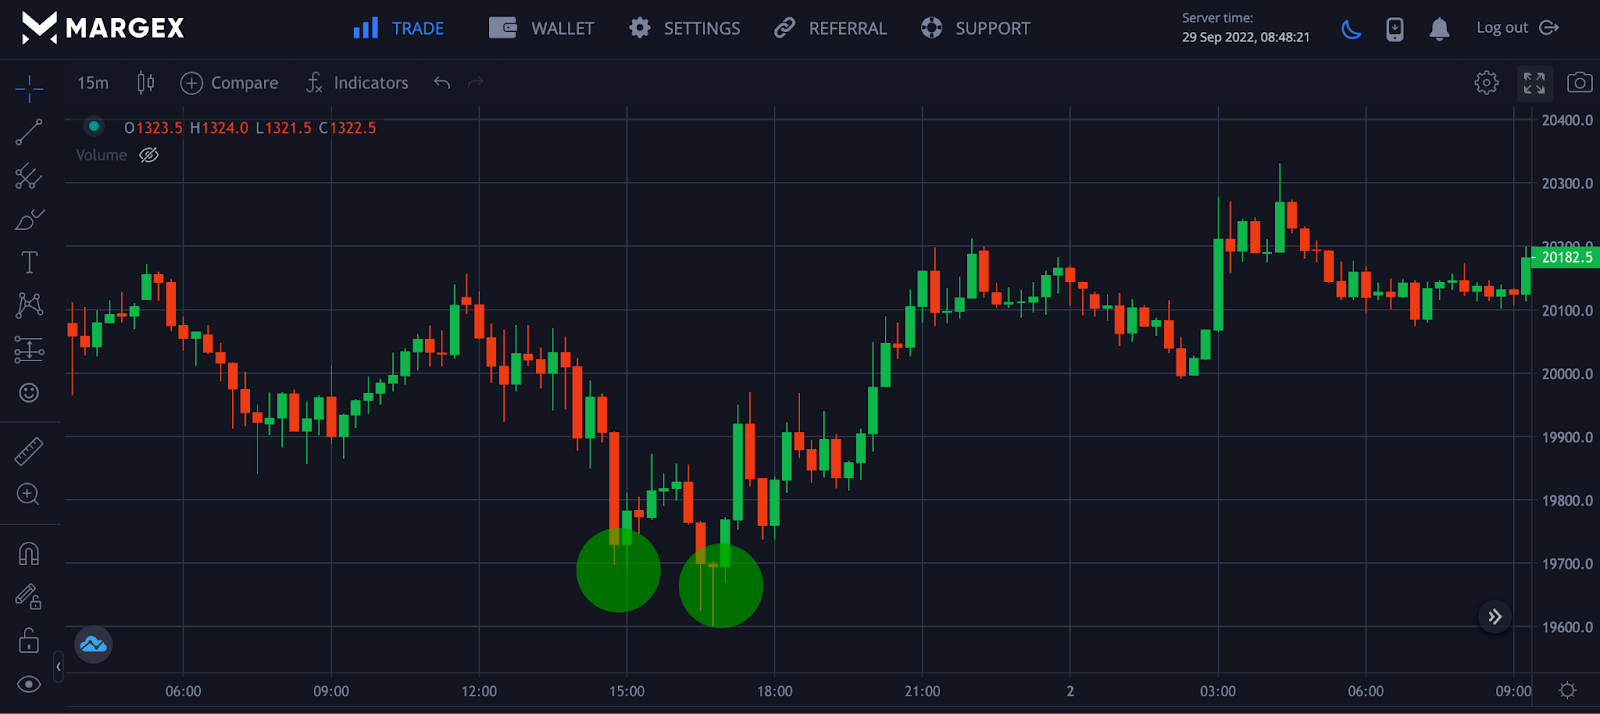
Double bottom pattern are strategies traders use to spot trend reversal after a considerable period of fall. The formation of the double bottom gives traders a signal of a potential price reversal from a downtrend to an uptrend. The formation of a double bottom coupled with a bullish pin bar candle pattern gives the trader more than enough reason that the bottom is in and a potential price reversal is imminent to the upside.
The double top pattern is the reverse of a double bottom pattern. The double top pattern confirms an uptrend reversal with price likely to start a downtrend movement. If such patterns are formed with a bearish pin bar or hanging man, this could give a trader enough reason to go short on a particular asset.
Pin Bar Strategy Tips
It is challenging to build a trading strategy that works; many traders and beginners are unsuccessful in trading because of a lack of strategy, psychology, and market edge. Defining your trading strategies and sticking to your plan of executing your plan is a great way to become a successful trader in the crypto market.
Once you have defined your strategies, backtested them to be successful under certain conditions that confirm your strategy. All you need do is repeat the strategy when the trading conditions are satisfied. Let’s discuss pin bar strategies to make you a more profitable trader.
- Pin Bar Range: We discussed tradable pin bars and their patterns in our discussion. Avoid trading pin bars with narrow ranges compared to the surrounding price action. Look for the pin bars that stand out from the rest of the price action.
- The Trend is Your Friend: Don’t trade pins against the trend on strong, trending days. There will almost certainly be a slew of them, and they will all fail. Create a context to filter out fading strong trends by combining strategies with others for greater and better success. Moving averages and indicators can determine the current trend and trade your pin bar strategy based on that trend.
- Try Volume Analysis: Some traders use the order flow to trade crypto assets as one of the core strategies in volume analysis. Volume is one of the most used indicators for trading. As an indicator, it is used in almost every strategy by traders to represent the market visually.
Three Biggest Mistakes You Must Avoid With The Pin Bar Trading Strategy
Trading the pin bar pattern without a good understanding of how to use it can be tough and lead to losses compared to profits. Here are common mistakes you must avoid when trading the pin bar strategy.
Assuming The Market Will Reverse Because Of A Pin Bar
Because there is a bearish or bullish pin bar in an uptrend or downtrend does not guarantee the trend to make a reversal. It takes more than a single candlestick to reverse a trend from going up or down. Major news and price action sometimes do not influence a trend reversal, so it would be good to watch the movement and reaction of prices when the pin bar appears before going long or short.
Giving Too Much Attention To The Pin Bar
Placing so much emphasis on just a pin bar to trade the crypto market can lead to losing opportunities. Price action influences the market; when they are considered with other strategies, you will have good trading opportunities.
Treating All Pin Bars Equally
What happens before the appearance of a pin bar places a key role in how you should approach the pin bar and the trading strategy to adopt. Sometimes a pin bar formation could be a consolidation before trend continuation; in cases like this going short or long could lead to a loss of funds.
FAQ: Frequently Asked Questions As Regards Pin Bar Candle Pattern
Trading the pin bar candle pattern is one of the many strategies traders employ in the crypto market to stay profitable. Here are the common questions traders have asked regarding using the pin bar candle pattern.
What Is A Pin Bar Candlestick?
A pin bar candlestick pattern is a single candle that gives traders a sign of a potential price reversal. This pin bar can be a bullish pin bar or a bearish pin bar. Trading the pin bar candle alone is not advisable as this could lead to false signals; it is encouraged to trade with other strategies for better profitability.
What Is A Bullish Pin bar?
A bullish pin bar is found at the end of a downtrend, indicating a potential change from a downtrend to an uptrend. The bullish pin bar tells us that sellers were in control of prices but were overpowered by buyers pushing the price higher and reversing the trend.
How Do You Trade A Pin Bar Candle?
Trading the pin bar alone is one of the mistakes most traders make; always trade the pin bar with other strategies to confirm the change in trend. To make better assumptions, you can use the Fibonacci retracement values, moving averages, and double bottom or double top patterns discussed earlier with the pin bar
How Do I Find My Pin Bar?
Finding a pin bar is not as tough as others see it. Pin bars are usually found in trends about to end, be on the watch to find pin bar candles as they are visible more to the eyes.
Can A Bullish Pin Bar Be Red?
Yes, a pin bar is bullish because it appears at the end of a downtrend, and the color doesn’t significantly impact it; what matters is where it appeared and the price actions accompanying it.


