
The practice of technical analysis helps to give crypto traders a read on the typically highly volatile asset class. Some tools are more common than others, while all of them serve a unique purpose and have a useful place within each trader’s toolset.
The Stochastic RSI is one of the more popular trading indicators today. It is an interesting tool that is created by applying the regular Stochastic oscillator formula to a set of Relative Strength Index data values instead of using price data.
The result is a more sensitive technical indicator that is focused on historical performance instead of recent price changes. The Stochastic RSI will display different readings from both the Stochastic oscillator and the RSI indicator.
Read the following in-depth Stochastic RSI crypto trading guide, complete with details on the tool’s definition, how Stoch RSI works, its calculation, and how to use it to trade crypto.
StochRSI Definition: What is Stochastic RSI In Crypto?
The Stoch RSI stands for the Stochastic Relative Strength Index. The tool was created by Stanley Kroll and Tushar S. Chande in the 1994 book, “The New Technical Trader.” The two leading technical analysts and authors’ last names are given to another technical indicator, the Chande Kroll Stop indicator.
Together the two sought to develop an indicator that improved the sensitivity of overbought and oversold signals and increased the number of signals over other technical indicators. To achieve this, the stochastic oscillator formula is applied to a set of RSI values.
The Stochastic RSI, like the Stochastic, is a bounded oscillator set within a range of 0 to 100. The Stoch RSI consists of two lines representing %K and %D. %K is often referred to as the fast stochastic, while %D is a three-period moving average referred to as the slow stochastic.
How Does StochRSI Work? Stochastic RSI Indicator Explained
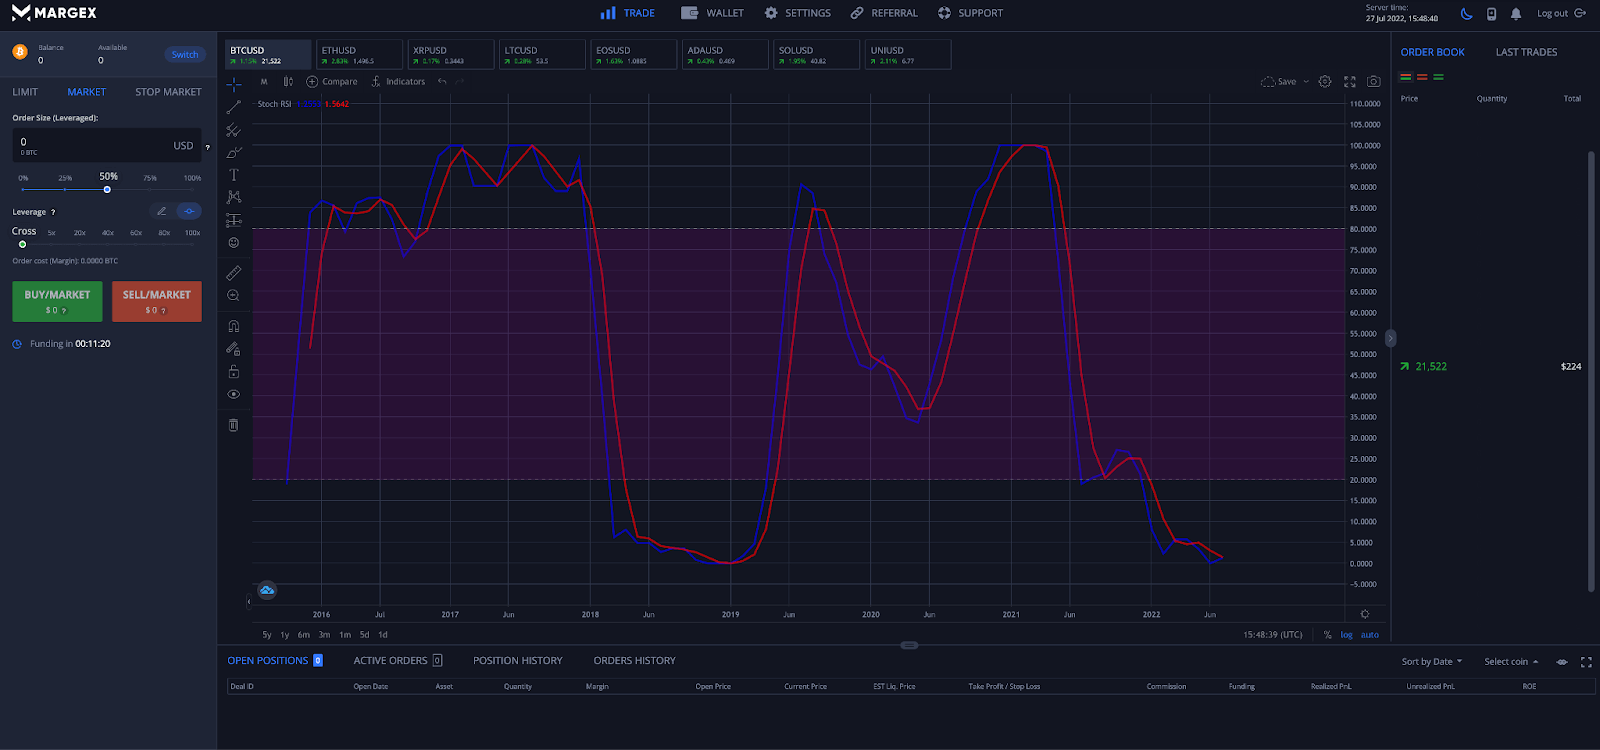
StochRSI values %K and %D move within a bounded range of 0 to 100. Readings over 80 suggest a cryptocurrency or other financial instrument is overbought, while readings under 20 suggest an asset is at an oversold level. The more extreme the reading, the more extreme these conditions are.
Stochastic RSI readings lower than 20 don’t immediately lead to a reversal, but because the asset is trading at the lower end of its predefined range, there is a higher probability that price may reverse from these conditions. The same is true vice-versa for readings higher than 80.
Passing through the center line at 50 is also significant when looking at the Stoch RSI. If the Stoch RSI pushes above 50 there is a higher chance of an uptrend continuing, while a fall below 50 suggests a downtrend will continue and strengthen.
Traders will want to watch for trending assets to reach overbought or oversold conditions before closing a trade or opening a new position.
StochRSI Formula: How To Calculate Stochastic RSI?
The Stochastic RSI oscillator formula is:
StochRSI = (RSI – Min RSI) / (Max RSI – Min RSI)
Where:
RSI = Current RSI reading
Min RSI = The lowest RSI reading over the chosen lookback interval
Max RSI = The highest RSI reading over the chosen lookback interval
(Note: Lookback periods are set to 14 periods by default)
StochRSI Settings For Crypto Trading
The Ichimoku and several other technical indicators can be optimized further for cryptocurrency trading. While there are no specific recommendations for crypto trading using the Stoch RSI, moving the boundaries for overbought and oversold conditions can provide more control and potentially filter out false signals.
How To Interpret Stochastic RSI Signals And How To Read StochRSI Charts
Stochastic RSI generates signals based on readings taken from the indicator within a range between 0 to 100. Any time the Stoch RSI %K and %D lines pass above a reading of 50, the trend is strengthening and the market is bullish. Passing below a reading of 50 suggests that the trend is strengthening and the market is bearish.
Readings below 20 indicate that an asset is oversold based on historical performance of the RSI, while readings above 80 indicate that an asset is overbought based on historical performance of the RSI.
The fast and slow stochastics %K and %D crossing can also generate short-term buy or sell signals. The Stochastic RSI is the most effective when used in conjunction with other technical indicators or chart patterns and signals for confirmation.
The Stoch RSI is a second derivative of price, meaning that it is two steps away from the current price data. This can lead to the indicator being out of sync with current market price action. The One drawback to the Stochastic RSI is that price volatility can cause rapid fluctuations in the indicator’s readings, creating a whipsaw of signals. Depending on the charting platform, users may be able to add a moving average to the Stochastic RSI to smooth out readings and provide more reliable signals.
Example Of How To Use StochRSI In The Crypto Market
Here is an example of how to use the Stochastic RSI indicator to trade cryptocurrencies like Bitcoin, Ethereum, Litecoin, XRP, and other altcoins:
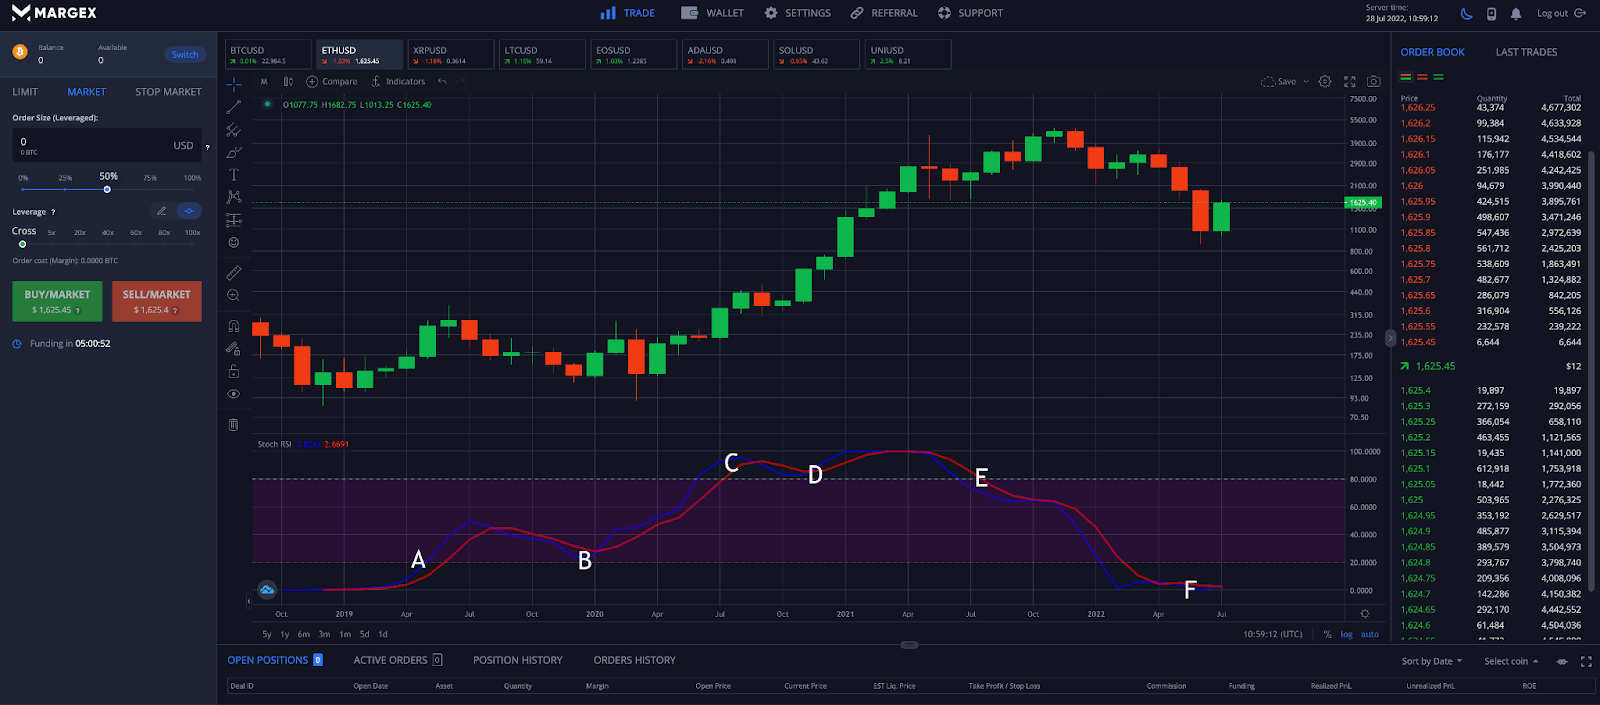
In the example above using Margex technical analysis tools, the Stoch RSI tells us the following signals.
A – Ethereum is coming out of oversold territory and has passed above a reading of 20 from below. This generates a buy signal on ETHUSD.
B – Momentum has turned bearish, but because Bitcoin failed to move below the boundary of 20 once again, it is a strong signal the bullish trend will continue.
C – After another large move up in Stoch RSI, momentum takes a short turn, making bears think they’ve gained the upper hand.
D – Instead, bulls prevent a cross down below 80, causing an explosive uptrend and Ethereum to remain overbought for an extended period.
E – Following several months of an uptrend, momentum finally begins to turn again, and this time a bearish phase is confirmed by the Stochastic RSI moving below 80 from above.
F – Ethereum is now back below 20 and at oversold levels once again. Traders would want to watch for the Stoch RSI rising back above 20 to generate another buy signal.
Advantages And Disadvantages Of Using Stoch RSI Indicator
Like any tool, there are always upsides and downsides to using them. Some indicators give false positive signals, lag behind trend changes, or create other issues.
Here are some of the most common advantages and disadvantages of using the Stochastic RSI indicator:
Stochastic RSI Crypto Trading Pros
✔️ More sensitive than RSI and other indicators
✔️ Gives clear and accurate signals
✔️ Predicts trend changes on higher time frames
Stochastic RSI Crypto Trading Cons
❌ Highly volatile readings can cause a whipsaw in signals
❌ Can be out of sync with current market data and price action
❌ Can be overly sensitive compared to other indicators
How To Trade With Stochastic RSI Indicator On Margex
The Margex trading platform offers built-in technical analysis tools that the pros rely on, like the MACD, Ichimoku, Bollinger Bands, Fibonacci tools, and the Stochastic RSI. Here is a step-by-step guide on how to use the MACD to trade crypto with Margex.
Step 1 – Scan a cryptocurrency price chart like Bitcoin on any timeframe and scan for the Stochastic RSI passing below a reading of 80 from above, or passive above a reading of 20 from below.
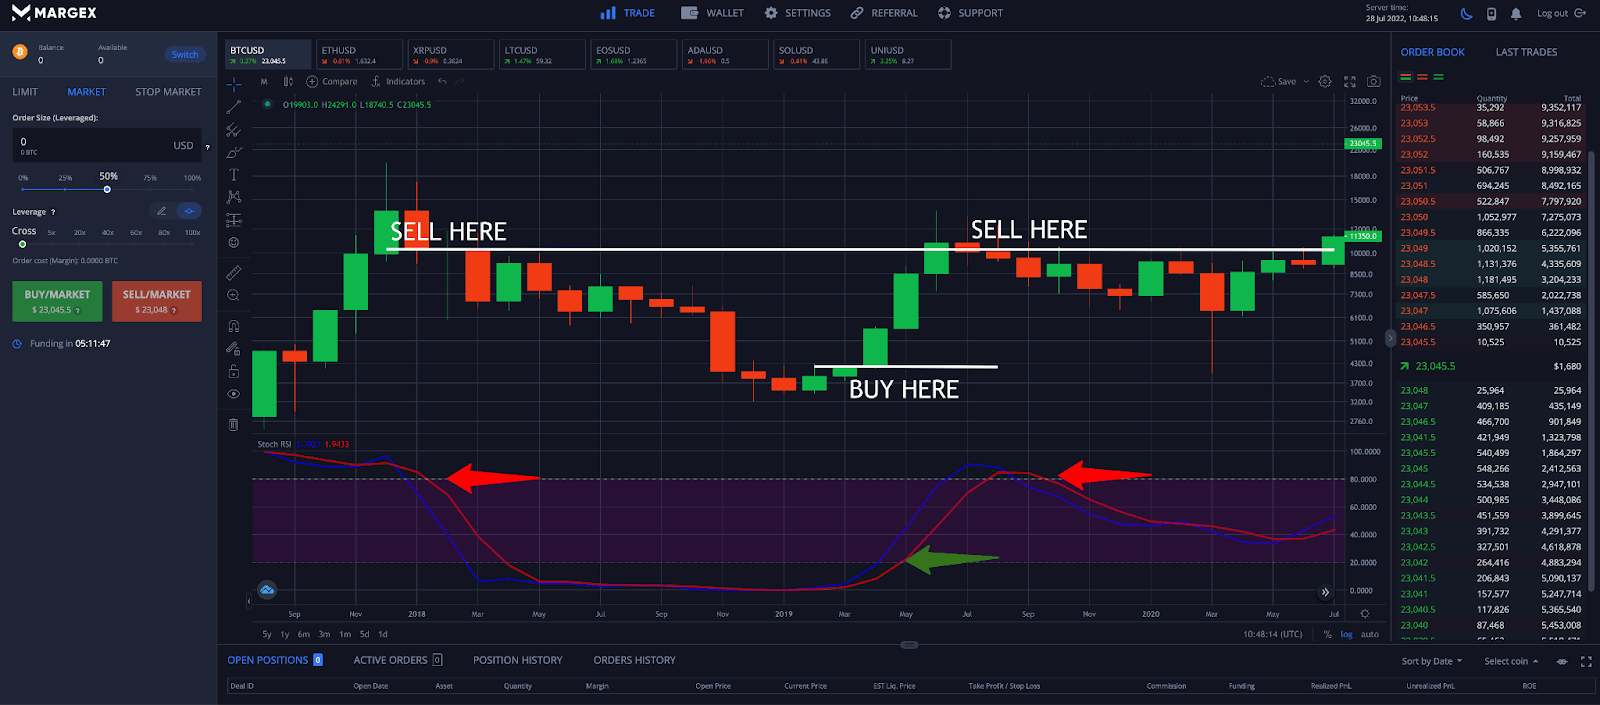
Step 2 – Place a buy or sell order for crypto after the signals in step 1 are confirmed with a candle close. The above example shows three successful trades in a row using the Stochastic RSI as a signal. Two sell signals occurred at the same resistance level.
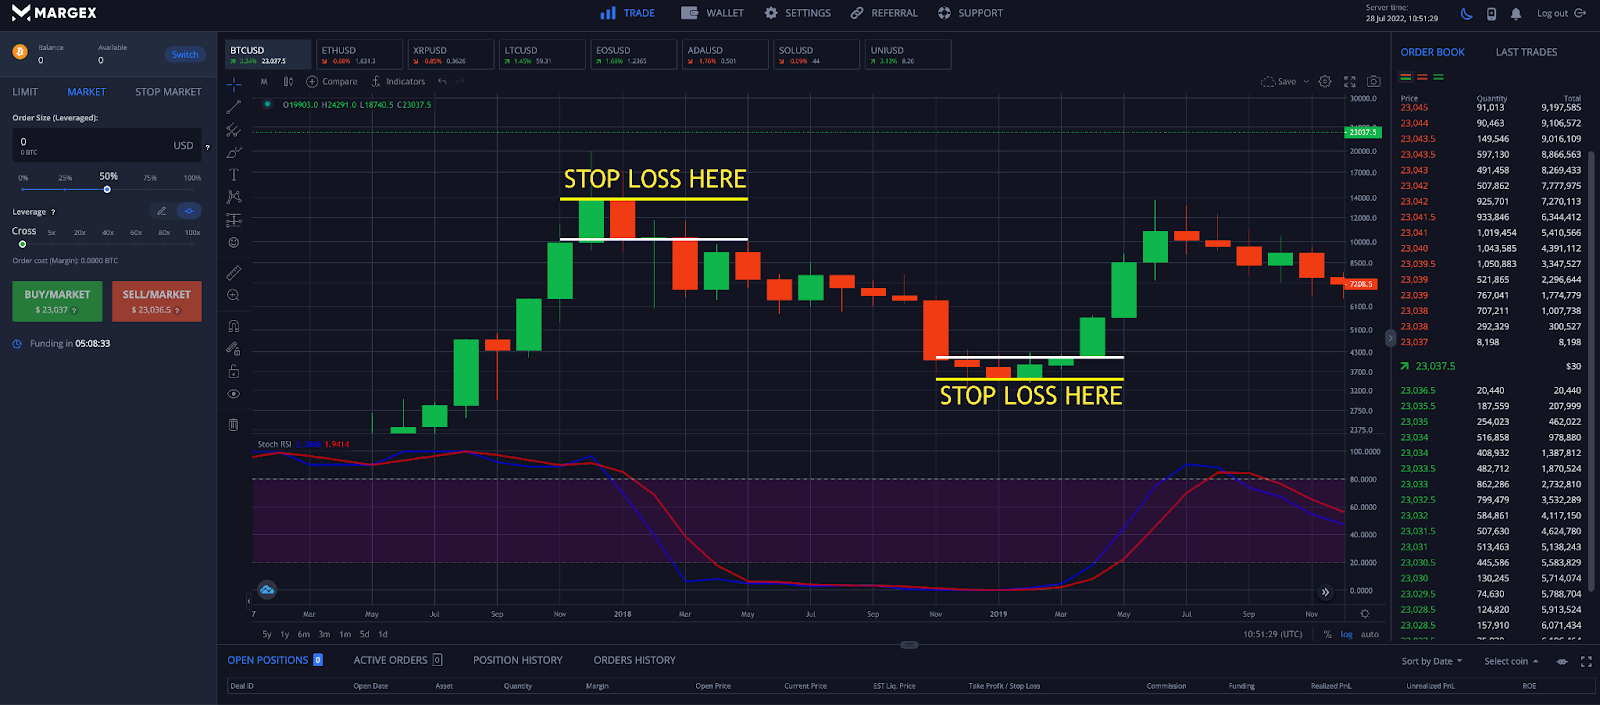
Step 3 – Place a stop loss order below the entry candle where the signal was generated. A sell order should place a stop loss above the candle open, while a buy order would place a stop loss below the candle open.
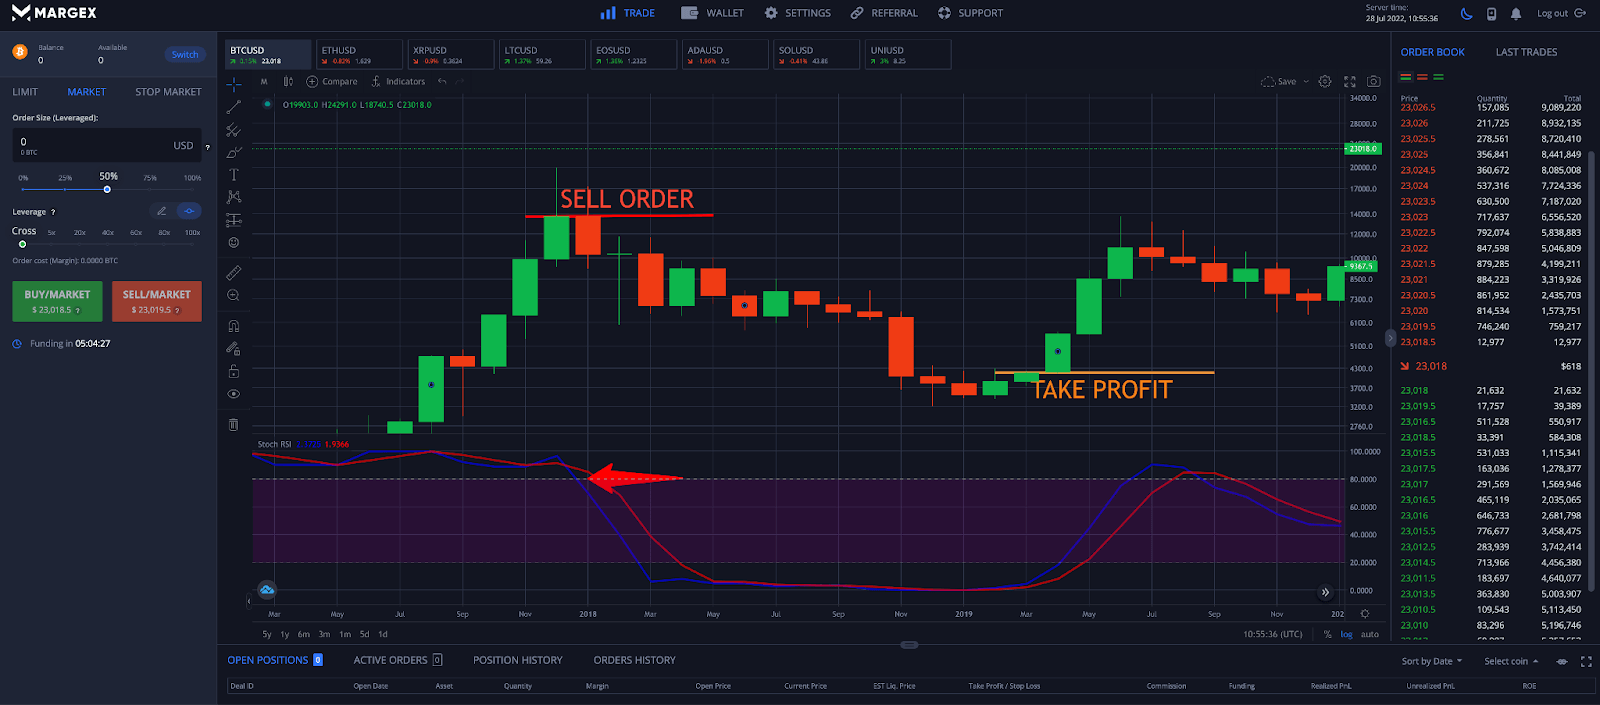
Step 4 – The opposite end of the range of the Stochastic RSI can also be used as a signal to tell a trader when to take profit and close a position.
Stochastic RSI Versus Relative Strength Index
The Relative Strength Index is a popular momentum indicator used by crypto traders. The Stochastic is another momentum indicator comparing the closing price of a cryptocurrency to a historical range.
The Stochastic RSI is a Stochastic that uses RSI values instead of price data and compares it to a historical range. The result is a completely different tool that has unique attributes and is more sensitive and therefore generates signals more frequently.
Because of the sensitivity differences, the Stochastic RSI can reach extremes much more quickly than the RSI. The RSI is a derivative of price, while Stochastic RSI is a second derivative of price. One isn’t necessarily better than the other, and can be used together or in conjunction with other indicators like the MACD for greater success.
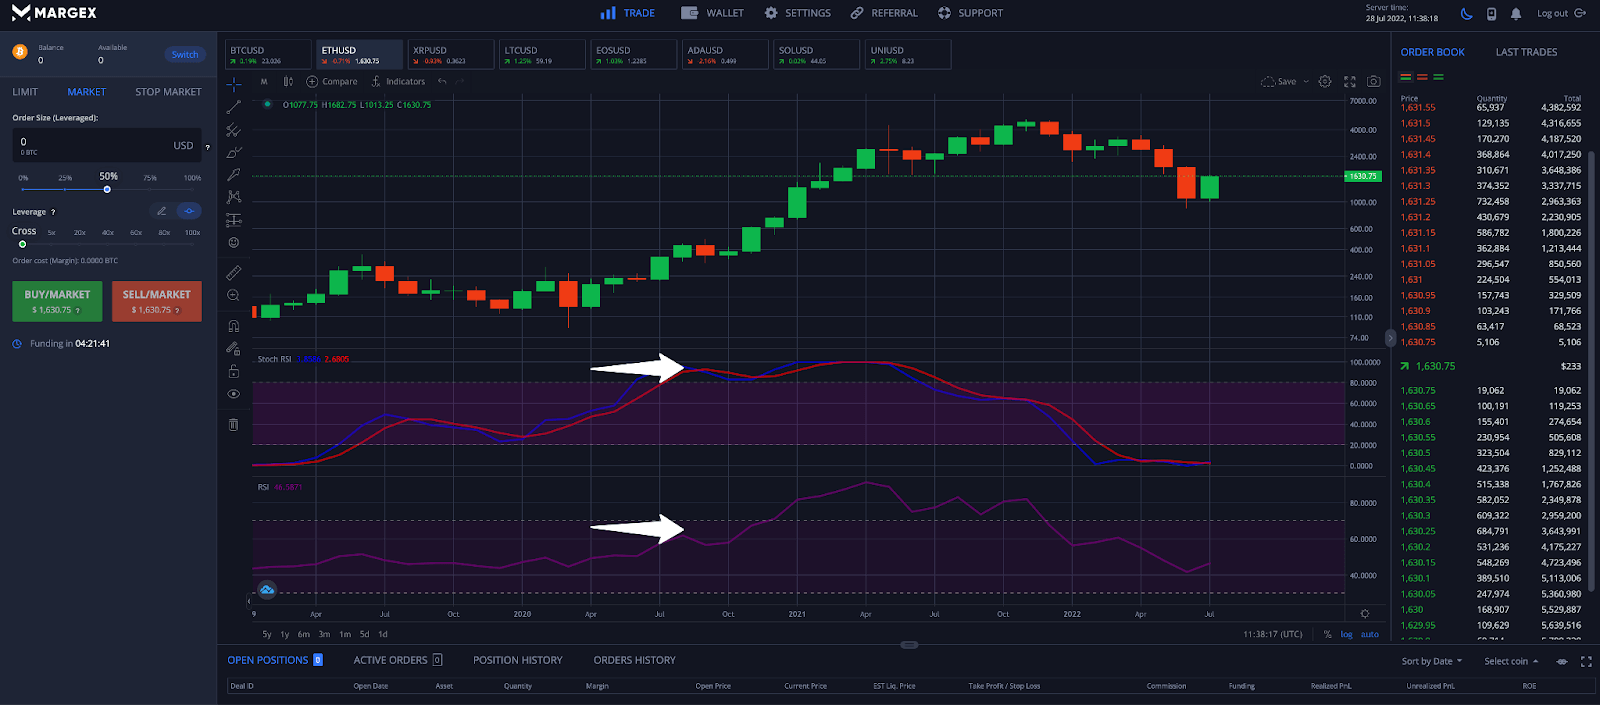
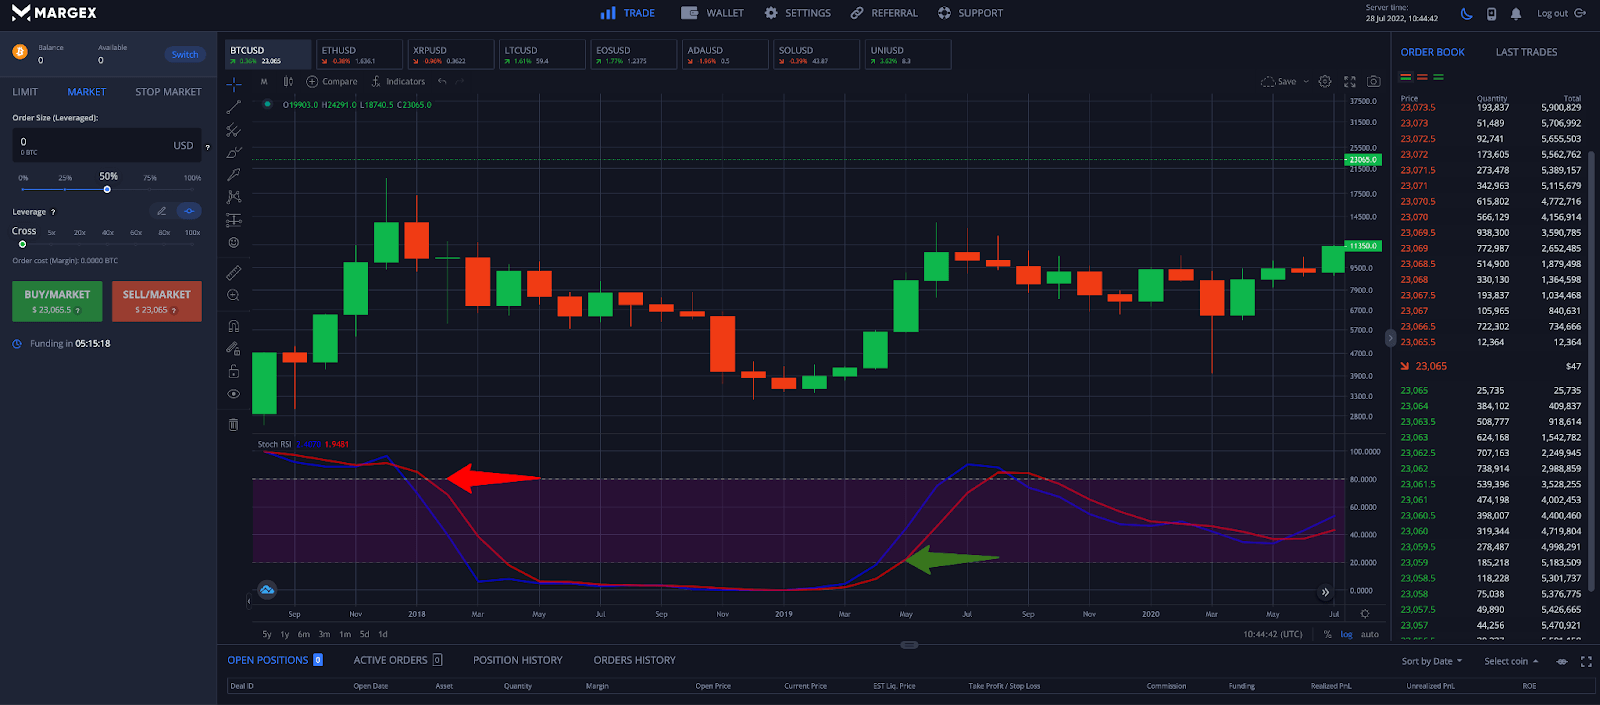
In the above ETHUSD example, Stochastic RSI reached an extreme reading and indicated oversold conditions long before the Relative Strength Index did. This is by design – the tool was intended to be more sensitive than the RSI.
However, this is also an example of how the Stochastic RSI can be too sensitive in some instances. Combining the Stoch RSI with the RSI and other tools is the best trading strategy.
FAQ
The Stochastic RSI is a technical indicator that consists of a Stochastic using Relative Strength Index values. Because Stochastic and RSI are their own indicators and behave differently from the Stochastic RSI, the three indicators are often confused and compared.
Here are some of the most commonly asked questions about the Stoch RSI indicator.
What is Stoch RSI?
Stoch RSI is short for the Stochastic RSI technical indicator developed by Stanley Kroll and Tushar S. Chande in 1994. It is a Stochastic applied to the RSI, hence the name Stochastic RSI. It consists of a %K and %D bound inside a range of 0 to 100. It is a popular trading tool among crypto traders, especially on higher time frames.
How to read Stochastic RSI?
The Stochastic RSI gives a variety of signals depending on its readings. Crossovers of %K and %D can generate a buy or sell signal, while readings of above 80 and below 20 indicate when an asset is overbought or oversold respectively. When an asset is overbought or oversold, there is a higher chance of a reversal. Readings passing above or below 50 suggest a trend is strengthening.
Can I use Stochastic RSI and RSI together?
The Stochastic RSI and Relative Strength Index can be used effectively as part of a winning combination of technical indicators. These tools can be even more profitable when combined with chart patterns or Japanese candlestick patterns. The RSI will generate slower movements than the Stochastic RSI.
What is the best setting for RSI Stochastic?
The Stochastic and Relative Strength Index lengths are set to a default of 14, with %K and %D set to 3 periods. Oversold conditions are set at below 20 and overbought levels are above 80. However, traders can tinker with this setting to achieve greater control over signals.
Is Stochastic RSI a leading indicator?
Both the Stochastic and Relative Strength Index are leading indicators. The Stochastic RSI was designed to be even more sensitive, leading both of these indicators in generating signals. Therefore, the Stochastic RSI is a leading indicator and one of the fastest and most frequent in generating signals –– just as it was designed to do.
Is Stochastic RSI a good indicator?
The Stochastic RSI is a great trading indicator that can help a crypto trader to get into position without a high risk of losing money. Any indicator that can provide backestable results can be applied to an effective and profitable trading strategy.
Which is better: Stochastic RSI or RSI?
Neither technical indicator is better than the other and both have their own pros and cons and unique attributes. The Stochastic RSI is more sensitive than the RSI. The Stochastic RSI can provide early signals and when combined with RSI, the RSI can confirm those early signals and tell a trader to take action.
What are the drawbacks to using Stoch RSI?
The main drawbacks in using the tool is it can be too sensitive and generate too frequent of signals, leading to chop, false positives, and taking positions too early. Therefore, the Stochastic RSI is just one tool that should be used among many by traders when analyzing the crypto market.


