 Indicator In Trading")
Technical analysis of the financial market uses tools such as chart patterns, indicators, trendlines, and average true range (ATR) to determine the best exit, entry, trailing stop loss, and position size in trading activities.
The crypto market is highly volatile, changing from a region of low volatility to a region of high volatility and vice versa; the average true range can be used to determine explosive breakout trades and exits after the trend. The average true range can be applied in all financial markets, forex, crypto, or others.
One of the most difficult aspects of trading in the financial market, including cryptocurrency, is minimizing risk and loss while maximizing profit using market analysis tools like average true range (ATR).
This average true range guide focuses on how to draw ATR, how it works, how to calculate ATR, what ATR tells you, and how to spot great trading opportunities using this simple but powerful technique.
What Is ATR And How Do You Use It
The average true range (ATR) is a technical analysis indicator used to determine the price volatility of crypto assets. This tool can be used in the forex, stock, and crypto market.
Technical Analyst Welles Jr introduced this tool in his book Concept in Technical Analysis Trading.
The ATR indicator helps traders to measure volatility and helps them to find the right market setup to maximize risk. Most crypto traders struggle with position size or stop loss; ATR is not just an indicator but a great tool that helps traders manage risk reasonably as they employ stop loss in place.
Stop loss orders can be tricky for most traders; a wider stop loss exposes traders to losing so large amount of money, and a more minor or tight stop loss would expose the trader to being knocked out of the market in no time.
Understanding ATR as a trader gives you an edge over others in the crypto market. Your chances of being on the good side of volatility are usually on the high side.
It is important to note that ATR is not a trend indicator but a volatility indicator; most traders have a misconception about ATR being a trend indicator; ATR helps traders measure the market’s volatility, not the trend. This market volatility is not only present in a downtrend or uptrend market but also in a ranging or sideways market.
When using the ATR, it would be unwise to use it as a stand-alone without a trading plan or other indicators to validate trading setups. ATR is used to determine market volatility, not as a trend indicator. Using the ATR with a proper trading plan will give you more opportunities after validation from other trading tools.
How ATR Indicator Works
The ATR is a tool used to measure volatility and know the entry and exit of the market. It would be wrong to use ATR as a trending tool for trades. ATR gives a price range in the market; for example, if the price of BTCUSD is $24,500 on the ATR for a period, it would be unwise to go long at that price when the ATR indicates the range of price would be found around $24,500.
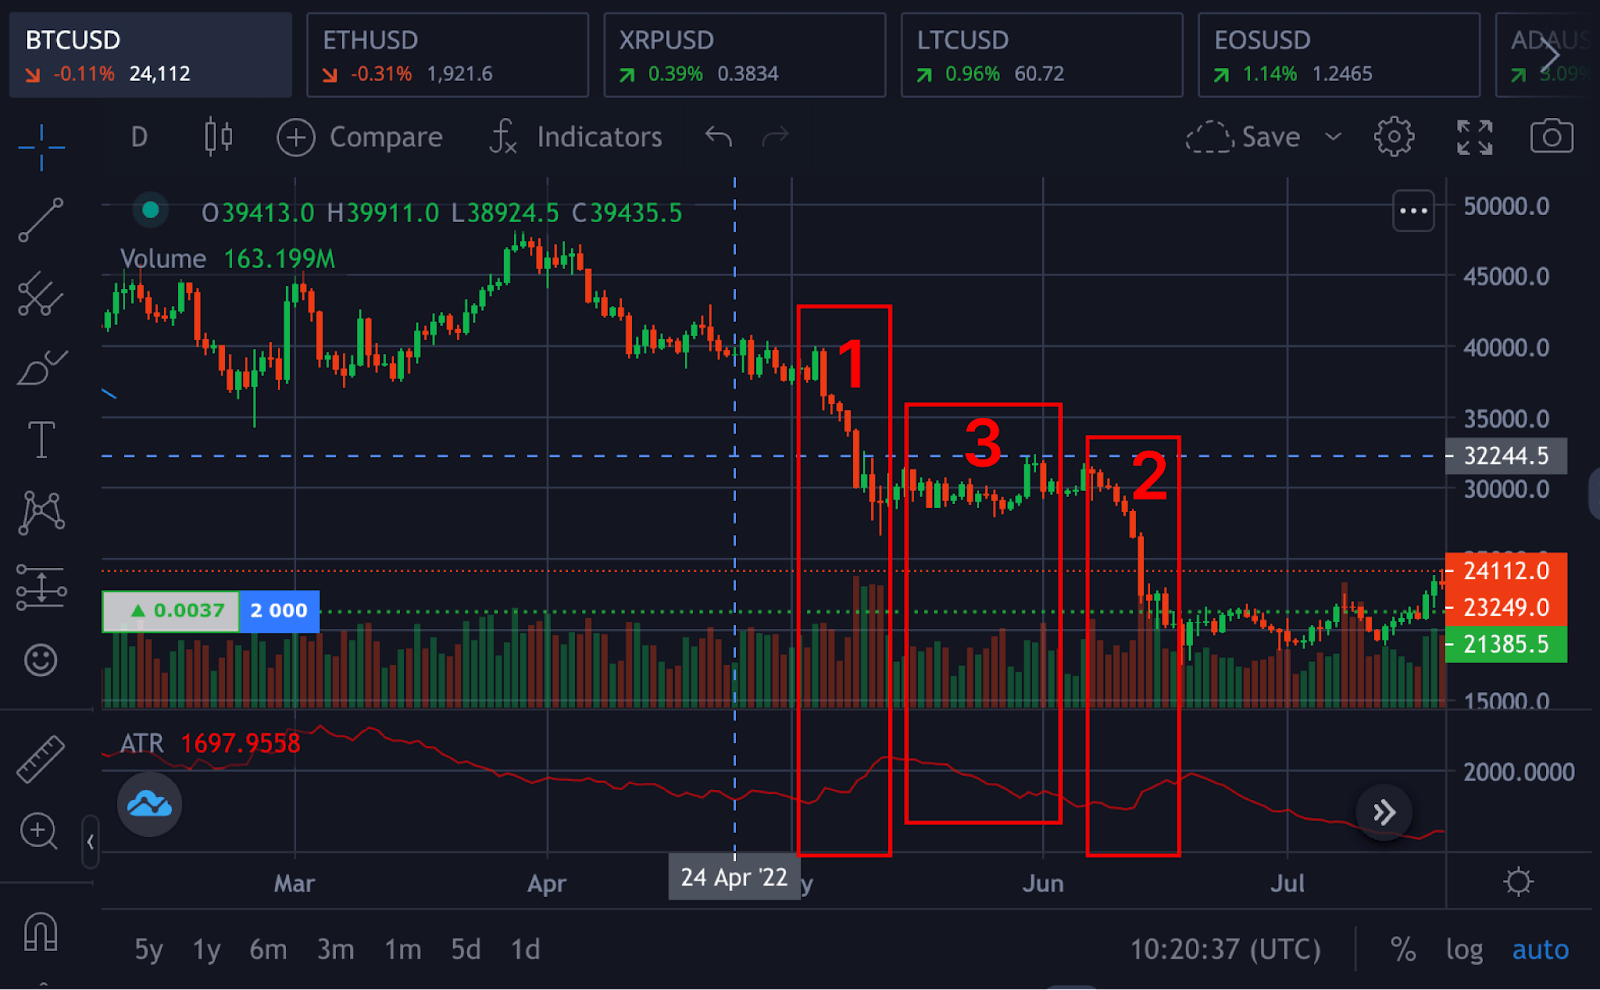
- The ATR indicates an increase in volatility in the market as the ATR increases or expands. From the image, as the price in the market aims to lower, the ATR would indicate the strength behind the move by a sharp increase, and this increase can only be sustained for a short period. An expanding ATR in either an upward or downward direction signals an increase in volatility for that particular price, as seen in 1 and 2 of the labeled image.
- A low ATR, as seen in label 3, indicates low, low volatility with more price ranges. This low ATR values are common during an extended sideways price action after a downtrend or an uptrend, thus indicating a price consolidation at that point with the possibility of a major move starting soon.
ATR is very useful when it comes to stopping loss and entry triggers as a result of crypto market volatility. Due to market volatility, it is easy to be stopped out of a trade, and approaching this as a crypto trader using multiple ATR gives you a better chance of not being stopped. Using 1.5 x ATR as a buffer for stop loss can prevent you from unexpectedly being kicked out of a trade.
How To Calculate ATR
Wilder explained the average true range indicator base on the calculation of true ranges in price over some time. There are three common ways to calculate the ATR of prices more simply;
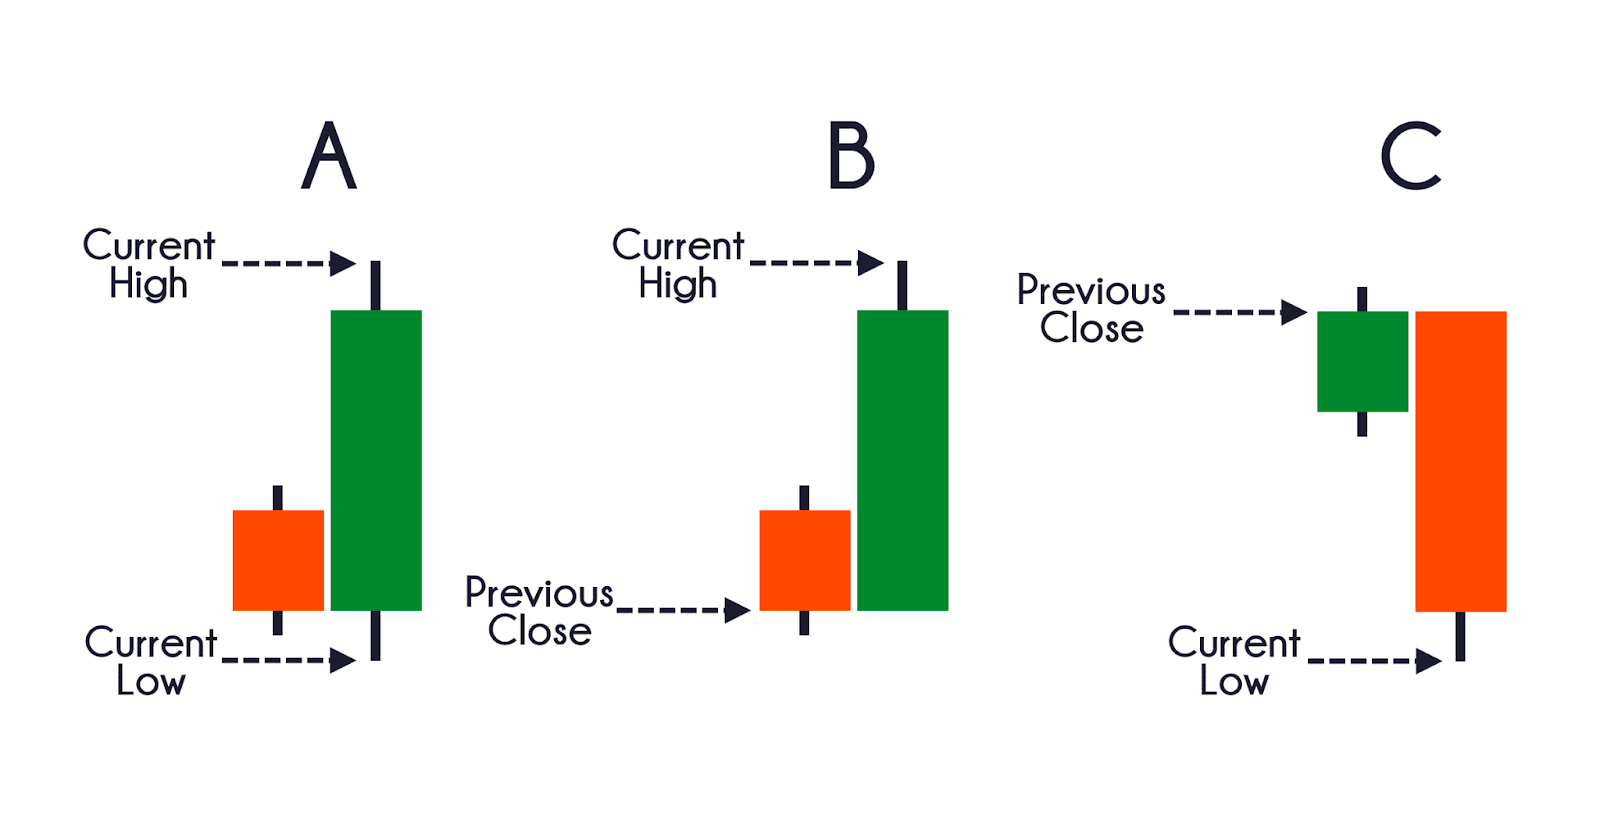
- The difference between the current high and the current low
- The difference between the current high and the previous close
- The difference between the previous close and the current close
This is simple to calculate following the image, and with a good understanding of candle sticks, the average true range of prices can be gotten; the ATR is gotten over a 14-period as a default value.
The Average True Range (ATR) Formula
According to Wilder, the smoothed ATR is gotten over the 14-period.
ATR = (Previous ATR * (n – 1) + TR) / n
Where:
ATR = Average True Range of prices
n = number of periods or bars
TR = True Range
The True Range for today is the greatest of the following:
- Current high minus the current low
- Current high minus the previous close
- Previous close minus the current close
What Does The Average True Range (ATR) Tell You?
Although Wilder developed ATR for indices and stock, it can be used for crypto as it is also prone to market volatility. ATR is used by traders to enter and exit trades and has become a useful tool for their trading system. ATR is not used to determine the direction of trade as most traders have a misconception but can be used majorly for volatility. It is used to measure the price action happening over some time.
Traders also use ATR as a trailing stop loss for their trades to avoid being stopped hunted, and as such, ATR is seen as a buffer during price actions. 1.5 x ATR is used to set a proper stop loss during trading.
How Do You Trade With The ATR indicator?
The average true range measures the volatility of the market, not trends or the direction of the market. Most traders have the misconception that ATR measures trends and indicates the direction of the next move.
ATR does not tell us the trend or direction but just the volatility around a price range. Traders use the average true range to trail stop loss orders. Suppose the ATR on BTCUSD indicates the volatility level is low. In that case, traders may decide to place a tight stop loss, but if the volatility on that day is very high, placing a tight stop loss would prematurely activate the stop loss.
A volatile market with high ATR would be ideal for placing stop loss far away from setups to prevent stop loss hunts during bigger price movements.
Example Of How To Use The Average True Range (ATR) On Margex
Margex is a derivative platform that allows crypto traders to trade different crypto assets with up to 100x leverage.
Margex is designed in such a way that the user interface makes trading simple even for beginners, and some of the features include
- There is no hidden fee.
- You can make a deposit of as little as $10 and trade with a leverage limit of $1!
- The user interface facilitates fast deposit and withdrawal.
- When you are already in a position, you can change your leverage.
- BTC, USDT erc20, USDT trc20, ETH, USDC, DAI, USDP, Tron, and WBTC are all accepted as collateral. You can also trade any trading pair with any collateral; there is no need to swap coins.
- Real-time trading requires technical analysis tools and charts.
- A referral program with a flat rate commission of up to 40%!
To begin trading on Margex, create new users and accounts and verify your email to gain access to the Margex UI page where you can enjoy trading, while existing users must log in. You can access Margex here.
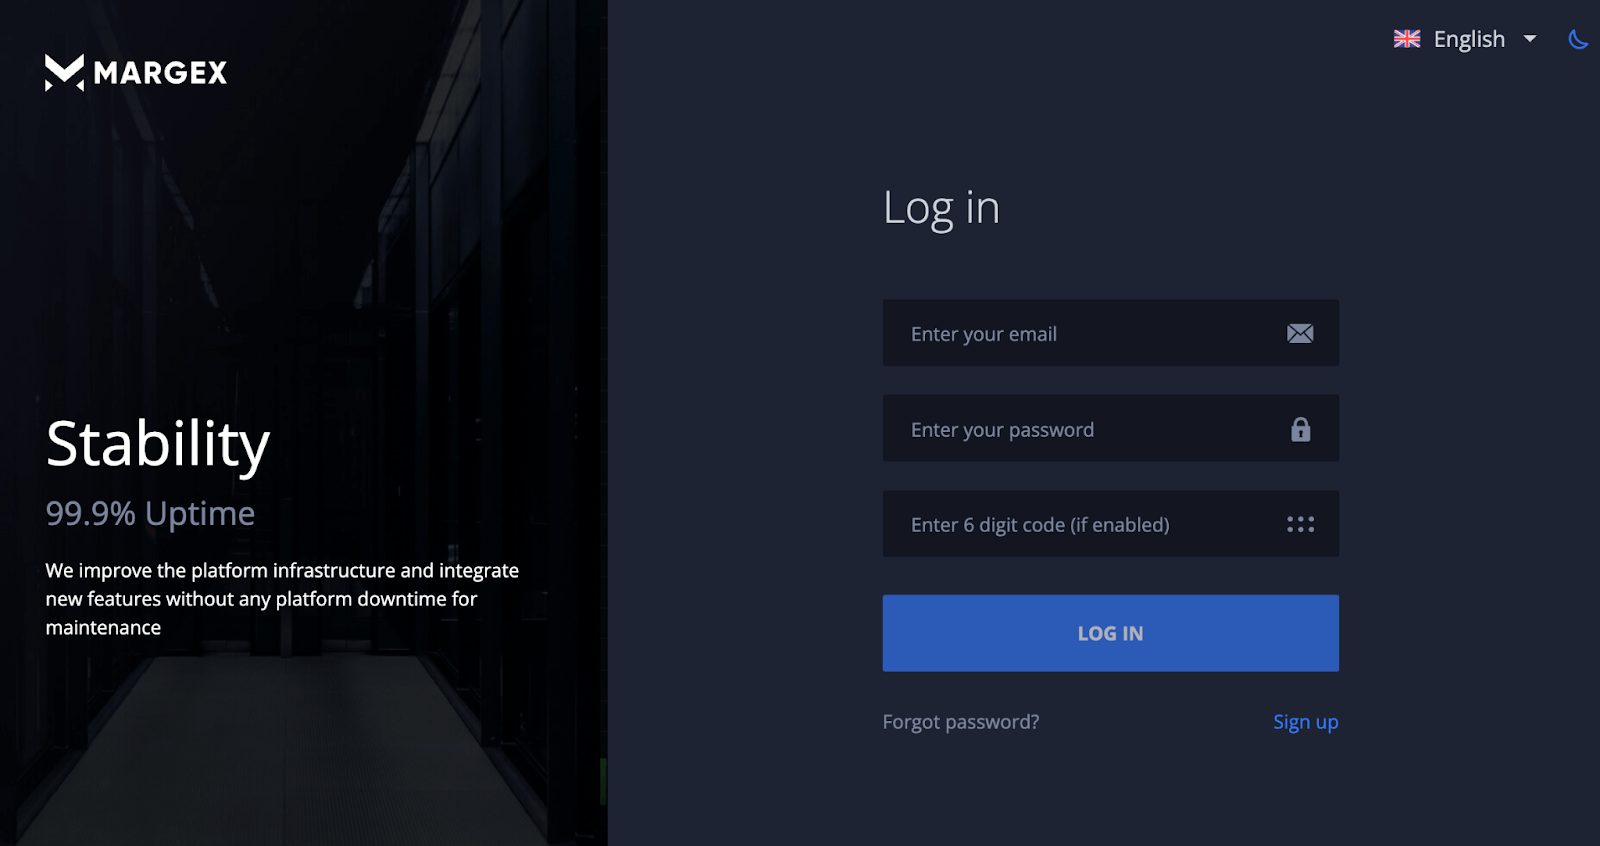
Assuming you have a login to the Margex platform, you will have access to their technical analysis tools, which are built with real-time prices to help you make money trading.
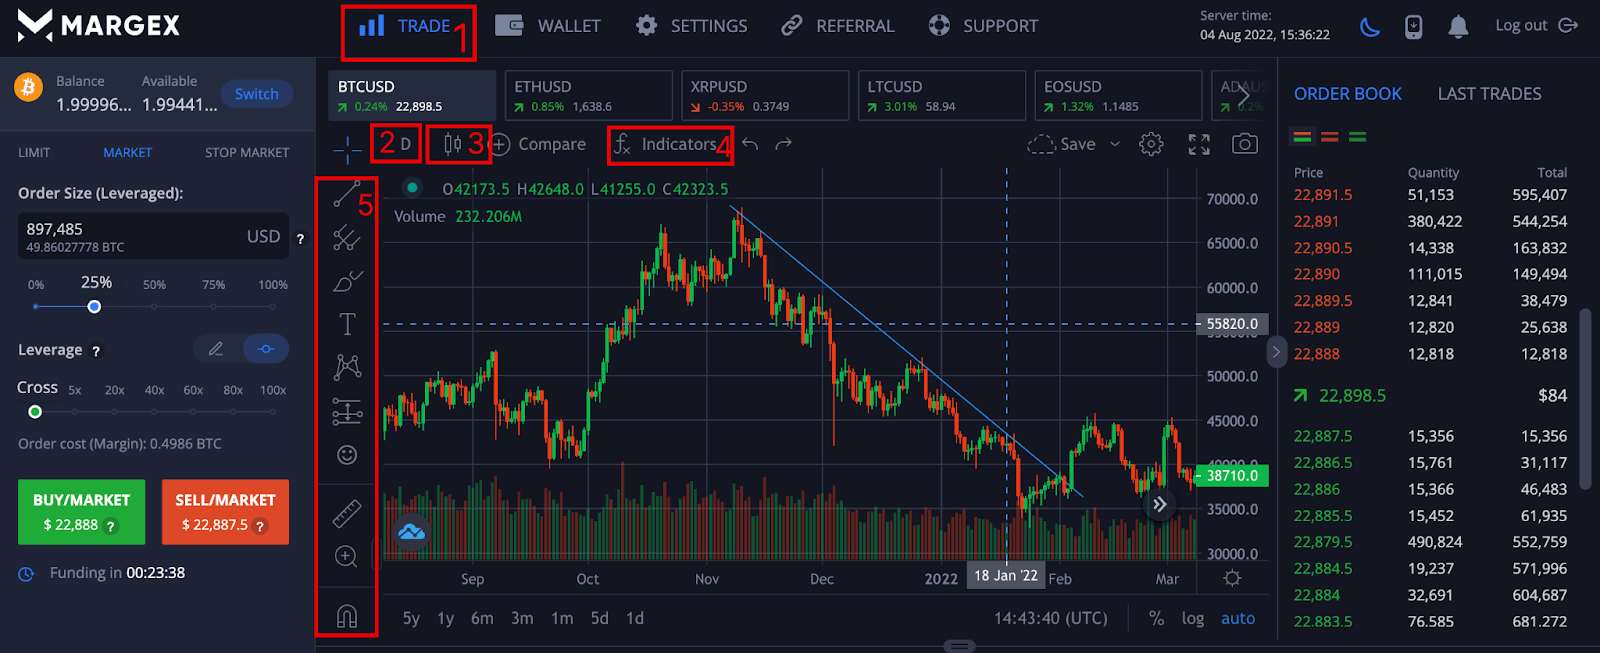
1. Trade – Click on trade at the top to access technical analysis tools where you can seamlessly execute your trades.
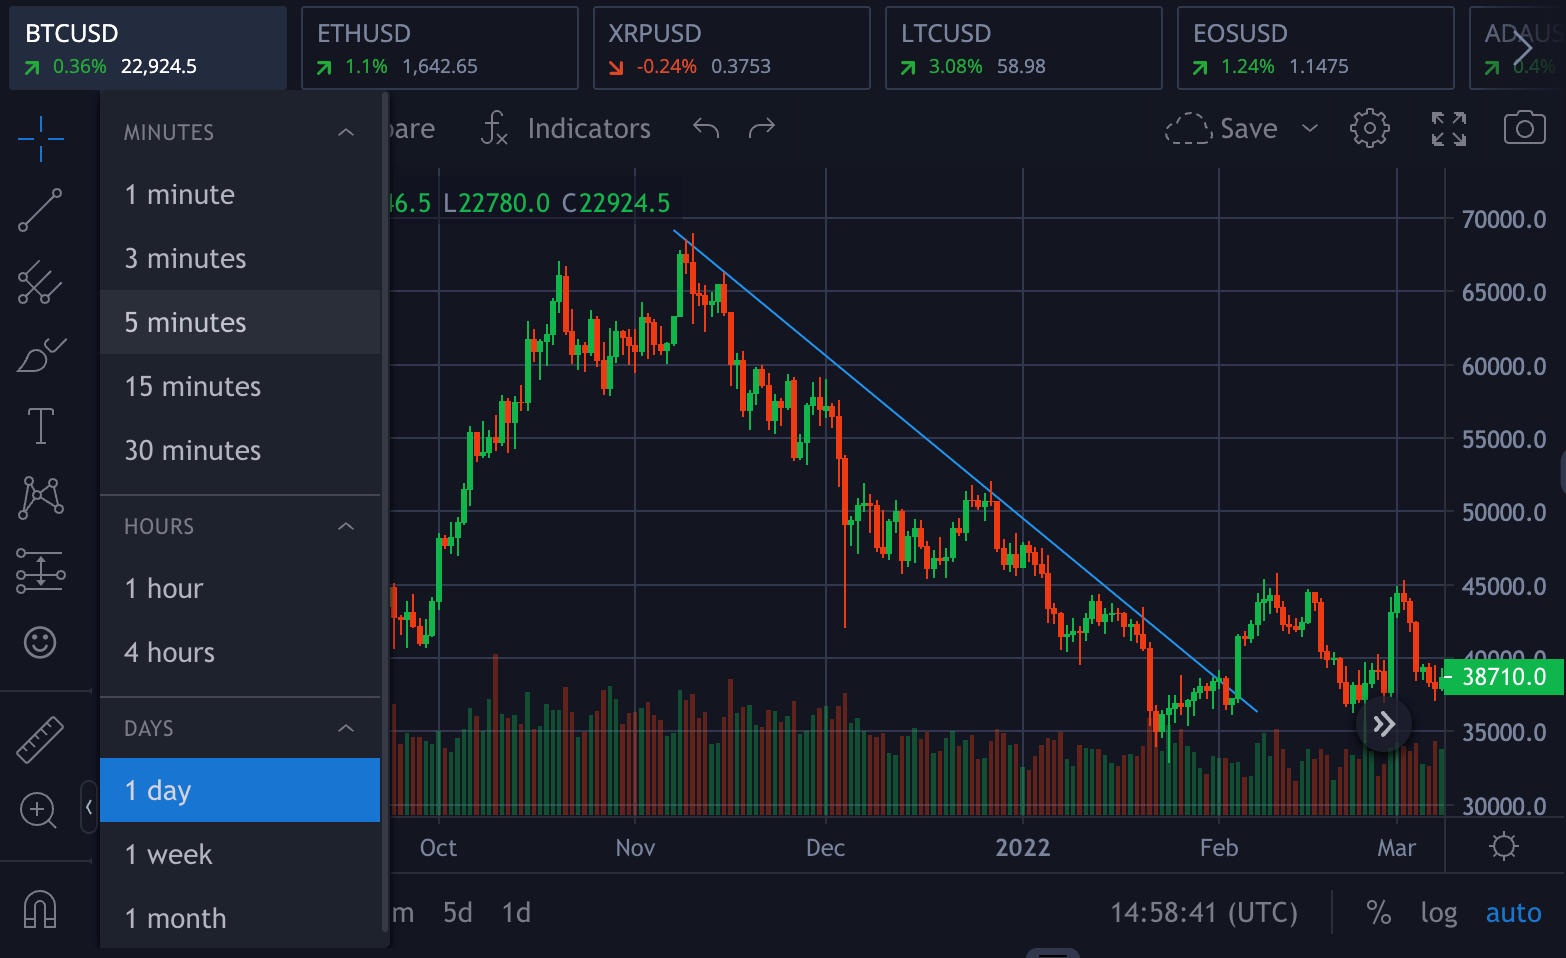
2. Timeframe – Click on the part labeled 2 to set the timeframe you want to trade based on your personality. You can choose between timeframes ranging from one minute to one month.
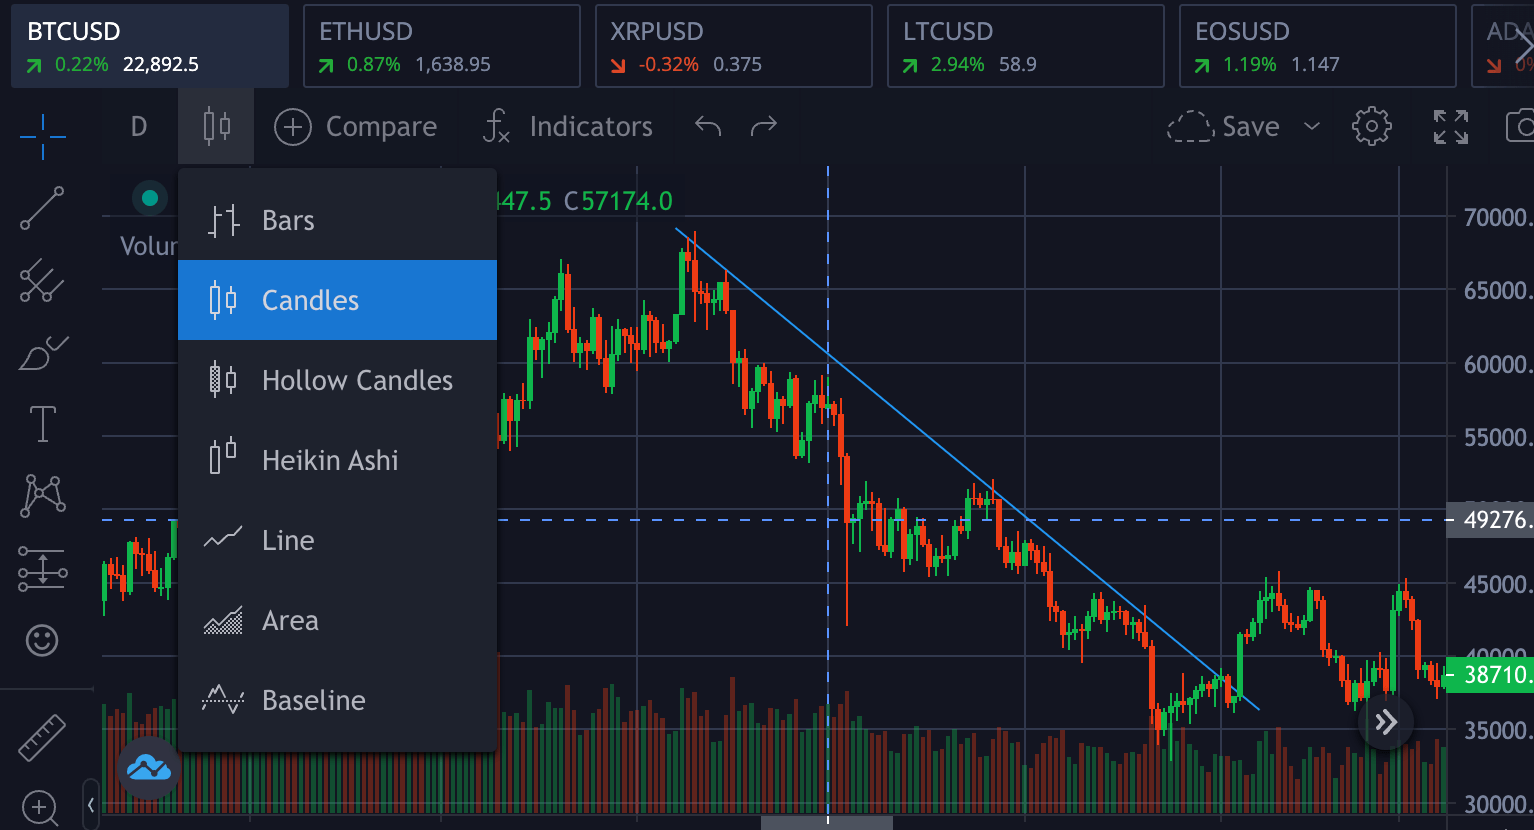
3. Candlestick – By clicking on the candles icon, you can switch from a line chart to a candle chart or vice versa.
4. Indicators – By selecting indicators, you will gain free access to all of the indicators available on the Margex platform. When you click on an indicator, it is immediately added. If you have a strategy in place, you can also look for your preferred indicator.
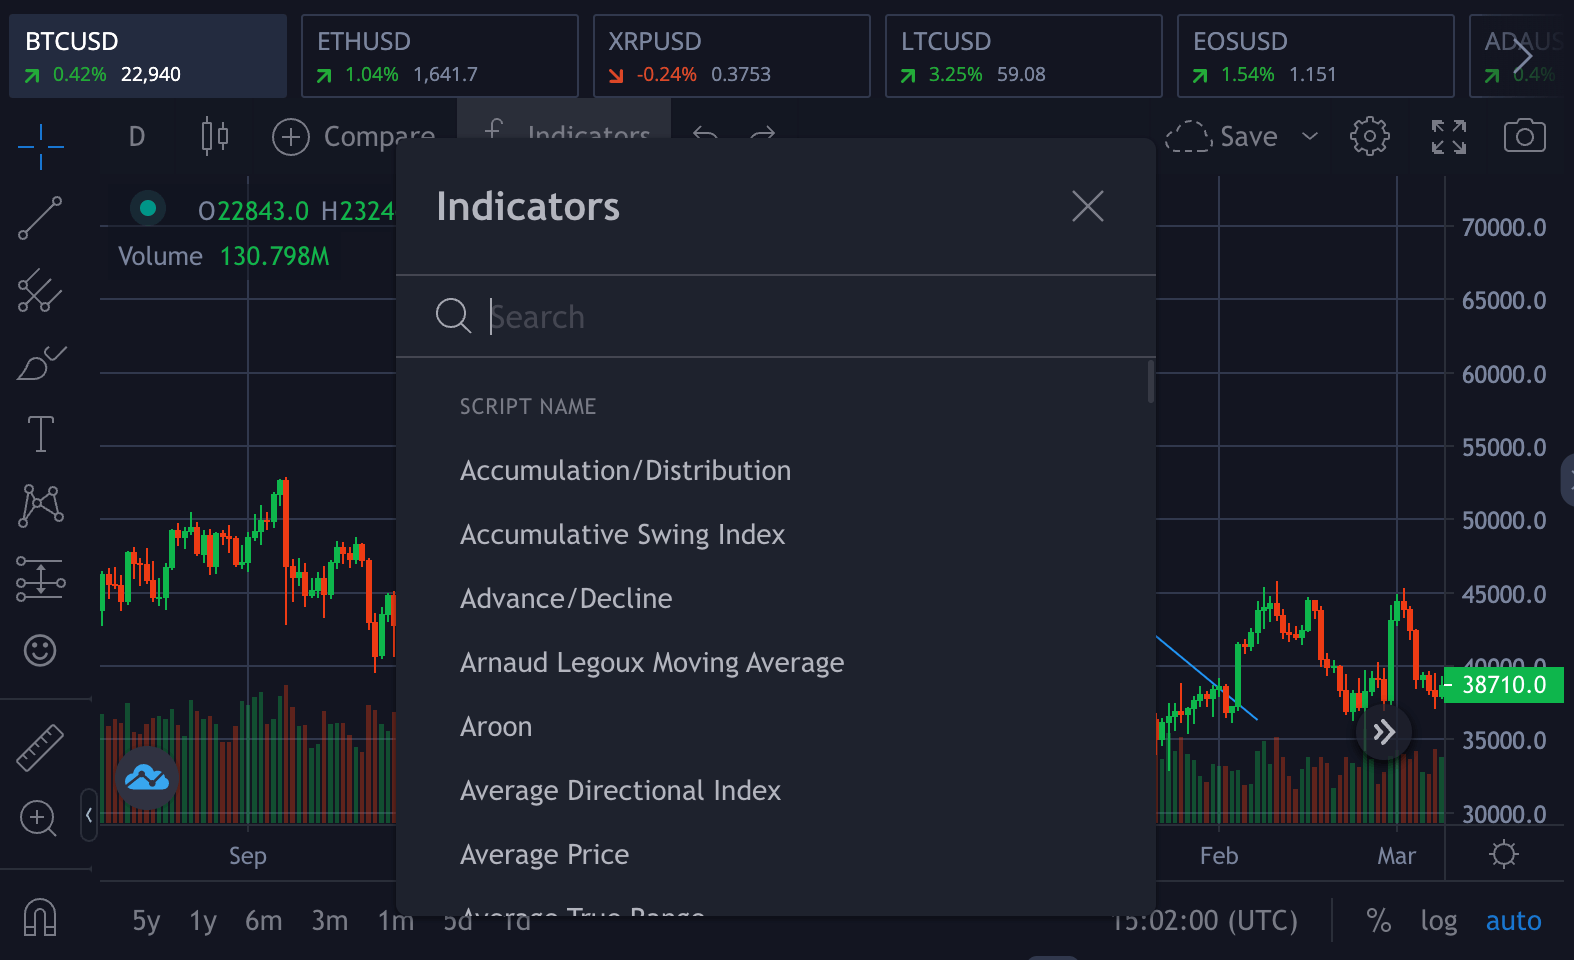
You can search for the average true range (ATR) to add the indicators to your trading strategy.
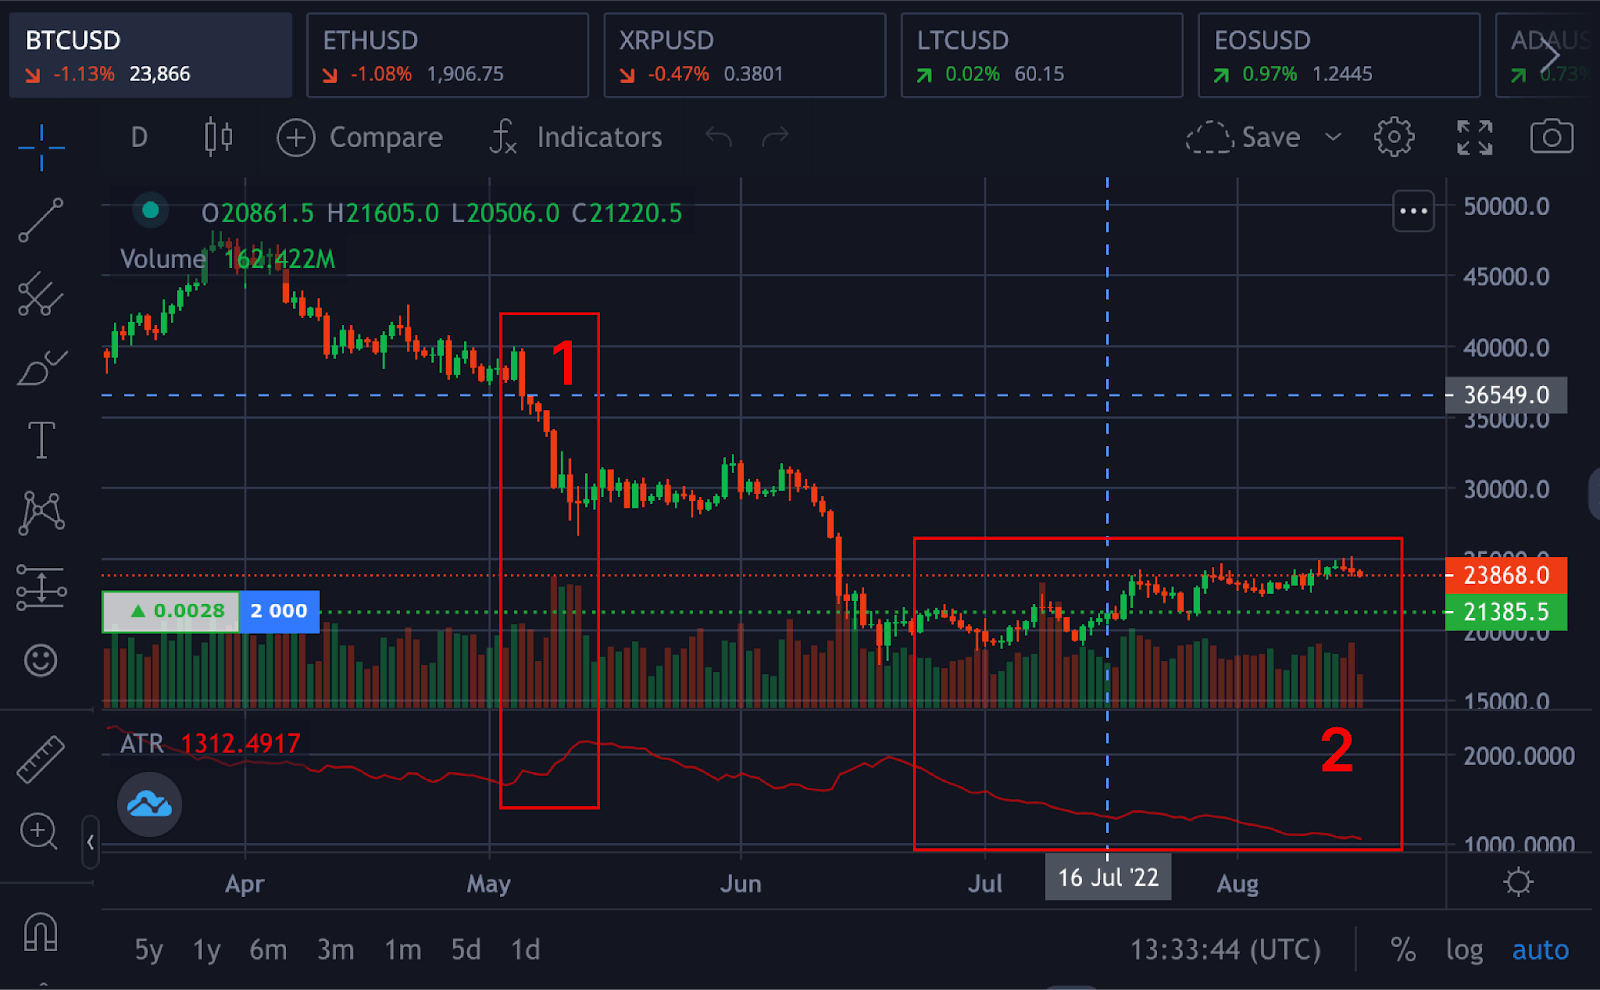
From the image above, after the ATR is added as a trading tool, its default range will be a 14-point; you can adjust it based on your preferences.
- The ATR in label 1 made a sharp expansion to the upside, indicating an increase in volatility followed by a downtrend in the market movement.
- Label 2 shows low volatility as the market is in a range; it is important to know that ATR does not indicate the market’s direction but can only be used to measure the market’s volatility.
How To Use ATR For Trailing Stop Loss
Before you trail the position in a trade, you should mark out all important areas, including your support and resistance levels. This will help you to determine where to set your stop loss.
To determine your trailing stop loss, use 1.5 x ATR, which will give good room for stop loss hunting. For example, the ATR for BTCUSD is 1000 at the current price of BTCUSD $23,800.
To set a good stop loss for either long or short position, you will do
Stop loss for LONG position = $23,800 – (1.5 x ATR)
Stop loss for SHORT position = $23,800 + (1.5 x ATR)
FAQ
There are numerous questions about the average true range indicator, including how to trade with it, the best settings, and so on. This section of the article focuses on the questions you want to be answered.
What Is A Good ATR Value?
There are no fixed or standard values for ATR, although the default value for ATR is 14-point. You can adjust the settings based on your preferences.
What Is The Best ATR Setting?
ATR setting has a default setting of 14-point, but this setting can be adjusted based on the investor or personality of the writer. Using a setting for ATR should be what works best for your trading strategies.
Are ATR And RSI The Same?
ATR is not the same as the Relative Strength Index (RSI). Traders or investors use ATR to measure the volatility of the market, time entry, and exits and use trailing stop loss to avoid stop hunting. RSI predicts the movement over a specified period.
How Do You Use ATR And RSI?
Using ATR and RSI is very easy, especially on the Margex platform. On Margex, you have access to these tools for free. Log into your Margex account and head to Indicators to search for ATR and RSI, then add them to your trading strategies.
What is ATR Stop Loss?
This is a way many traders use to figure out their stop loss and exit a position if a trade goes against them or goes in their favor. Learning how to use ATR would be handy and help you avoid prematurely leaving a trade.
How Do You Use ATR For Scalping?
ATR could be used with other tools and strategies to determine high probability setups for a scalp trade. ATR should never be used alone while trading as it measures volatility and stops loss trailing and exiting a position.


