
A divergence in global markets like the crypto market, forex, stocks, commodities and more, can be an early warning sign that the current market action is weakening, and a complete trend change and reversal could soon occur. Traders can use these early signals, especially after a long trend, in an attempt to predict future market movements and take spot or leveraged positions accordingly.
Because divergences can act as a reliable reversal signal, with a proper risk management strategy in place, traders can greatly improve the probability of success and lower the usually high risk of losing money.
The following guide will explain how to properly identify a bullish and bearish divergence in the price of an asset, and what the signals mean.
What Is Divergence?
A divergence is a discrepancy between the price of a cryptocurrency and a technical indicator or oscillator. Both price and the technical indicator will move in the opposite direction, creating a visible divergence on the price chart. A divergence signals that the underlying buying or selling supporting the current price action is weakening, despite prices increasing or decreasing.
In a divergence the technical indicator not displaying the same strength as price is an early indicator of a possible trend change.
Types of Divergences
Divergences, often called “divs” for short, can be bullish or bearish. In addition, there are two primary types of divergences: the hidden divergence, and the regular or classic divergence.
Divergences can also come in varying degrees of strength, with only the strongest and most pronounced divergences calling for immediate action. Smaller, less pronounced divergences might not be worthy of taking a position.
What Is a Regular Divergence?
A regular divergence – also called a classic divergence – signals a possible end to a downtrend or an uptrend and is a reversal setup. A regular divergence can have a bullish or bearish bias.
This type of divergence indicates the underlying strength of a trend is waning, the dominant side of the market is exhausted, and acts as a warning that a change in trend is possible.
What Is A Hidden Divergence?
A hidden divergence signals possible continuation to the previous trend and typically takes place at the end of a consolidation phase before resuming movement in the primary trend direction. For example, a hidden divergence during a correction could suggest more downward price action, while a regular divergence during an upward rally would indicate the prices could soon be headed lower.
What Is The Difference Between Hidden Divergence Versus Regular Divergence?
The main difference between a hidden divergence and a regular divergence is the result that occurs thereafter. A hidden divergence pattern is typically a continuation signal, while a regular divergence pattern suggests a reversal is on the way.
When To Use Regular Or Hidden Divergences
Regular or hidden divergences can be helpful for traders to predict a possible trend change. Traders can look for a bullish or bearish divergence during an especially strong trend to watch for warning signs the trend might soon end. Both types of divergences are only confirmed in hindsight, so traders should consider other signals, patterns, and technical tools for confirmation.
Technical Indicators With Identifiable Divergences
Fortunately for traders and investors, many technical indicators have been designed in such a way that divergences are easier to spot and provide more effective signals. These tools include the MACD, Relative Strength Index, On-Balance Volume, Stochastic, and Fisher Transform. However, these are only a small sample of the available indicators for analysis that will exhibit a divergence.
Relative Strength Index
The Relative Strength Index is a trend strength measuring tool, which can gauge if an asset is approaching oversold or overbought conditions. If the asset has reached overbought conditions, then price makes a higher high while the RSI makes a lower high, it is a bearish RSI divergence. If the asset has reached oversold conditions, then makes a lower low, while the indicator makes a lower high, it is a bullish RSI divergence. RSI indicator divergence is among the easiest to read and decipher as a trader and will be used in the examples below.
MACD
The MACD indicator is a market momentum indicator that can be used to identify and trade bearish and bullish divergences. The name of the tool is called the moving average convergence/divergence indicator, and includes the word “divergence” in the name. The MACD consists of a 12-period EMA and a 26-period EMA, as well as a histogram. Buy or sell signals are generated when the MACD line at zero on the histogram is breached.
Stochastic Oscillator
The stochastic oscillator is a momentum indicator that compares the closing price of an asset in relation to a range of price action over a certain period of time. The stochastic oscillator was developed by George Lane in the late 1950s and also uses support and resistance levels. It is a range-bound oscillator that indicates an asset is overbought and oversold when at the upper and lower boundary of the tool.
Fisher Transform
The Fisher Transform is a technical indicator designed by John F. Ehlers that converts price into A Gaussian normal distribution and is used to make turning points more clear on price charts. It is a statistical tool that works based on a standard deviation.
On-Balance Volume
The On-Balance Volume indicator, called OBV for short, is often referred to as the smart money indicator, because it can be used to spot when larger investors are taking positions early. Because of this effect, bullish and bearish divergences can be especially helpful in predicting trend reversals. On-Balance Volume can also be used to confirm movements.
How To Identify Regular And Hidden Divergence Patterns
Using the Margex platform, below we have provided examples of how to find bearish and bullish divergences, both hidden and regular.
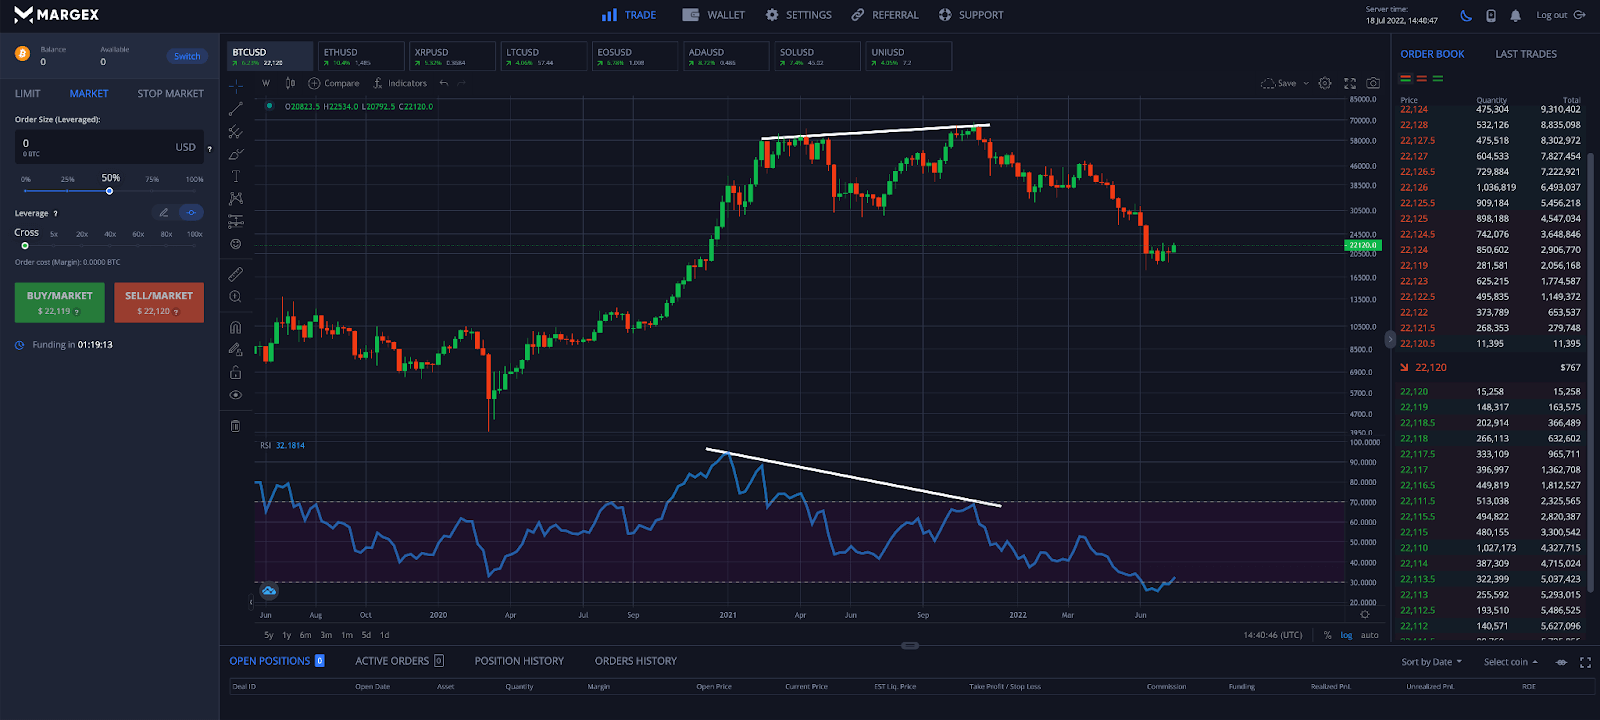
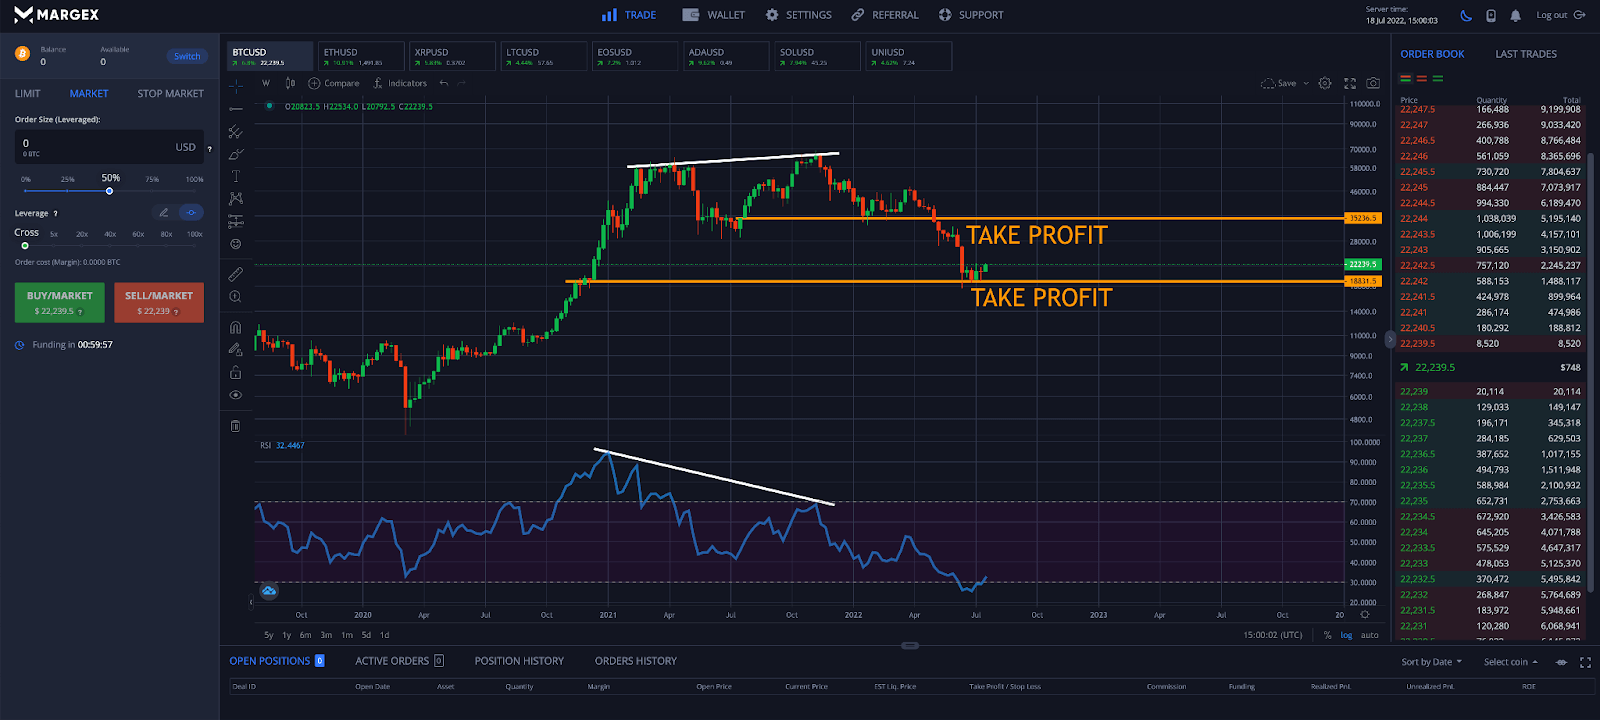
In the above RSI divergence chart example, the second Bitcoin rally failed to make a higher high on the RSI, creating a regular bearish divergence. The inflationary macro environment proved to be too bearish for the top cryptocurrency to continue its bullish trend and a strong retracement followed. As you can see, RSI divergences are easy to spot.
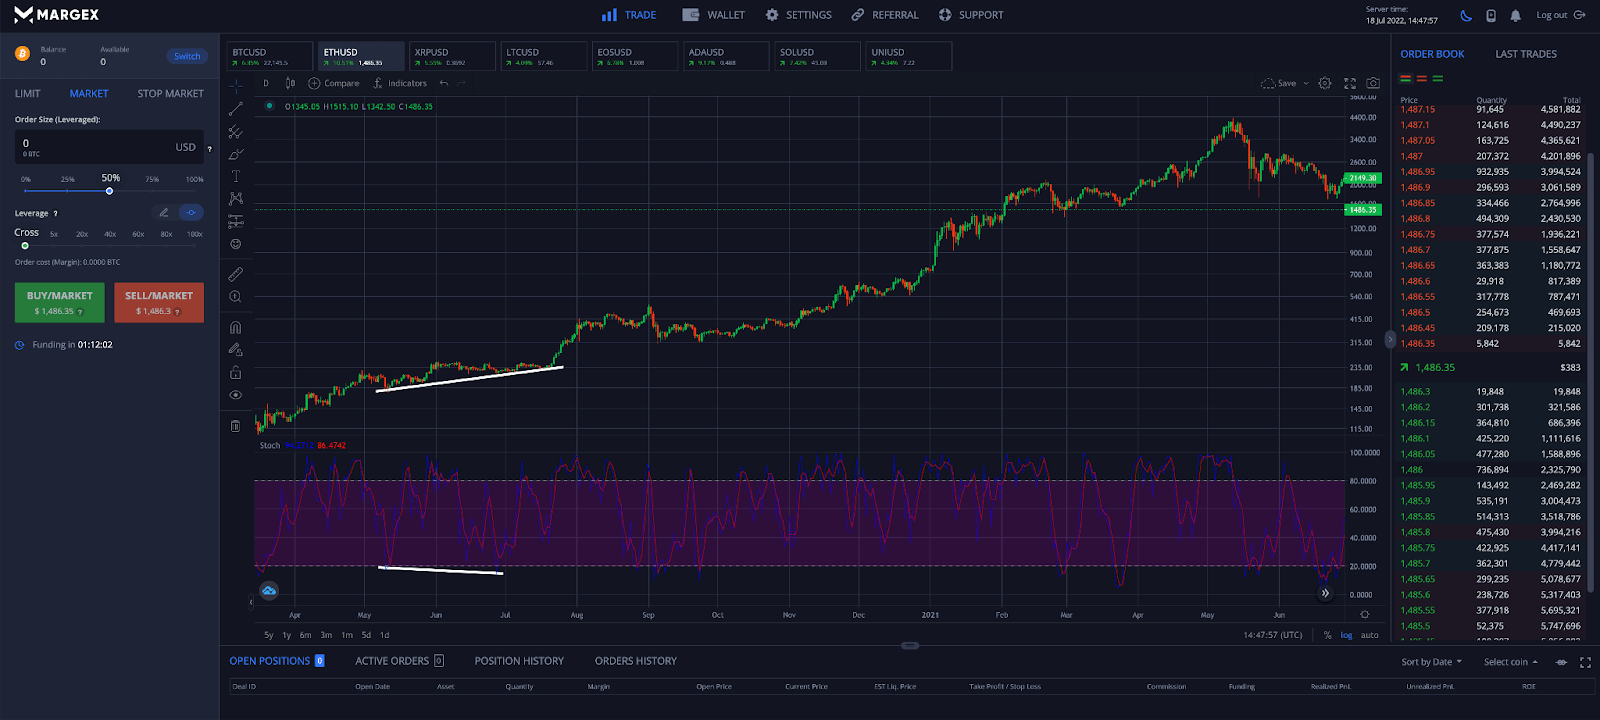
In the above crypto chart example, using the stochastic oscillator on ETH price charts, a more than 1,500% price increase in Ethereum followed the bullish hidden divergence. As the example shows, a bull divergence can be a powerful signal.
What Is The Difference Between Bullish Divergence Versus Bearish Divergence?
The main difference between a bullish divergence and a bearish divergence is the direction of the price movement. If the price is moving up, the divergence would be a bearish divergence. Positive divergence would confirm the move up, while a divergence would indicate a weakness underlying the move. If the price is moving down, the divergence would be bullish. Divergences can help the untrained become more successful.
How To Trade Bullish And Bearish Divergences On Margex
Trading divergences are possible using the built-in technical analysis tools offered by Margex. Take a look at the four simple steps to trading bullish and bearish divergences.
Step 1 – Use Margex drawing tools to draw trend lines across the largest peaks in price action and along the RSI. If you notice a divergence, you might want to consider taking a position.

Step 2 – After careful review, the bearish divergence is occurring at resistance and after reaching oversold levels. This is a good opportunity to sell or short Bitcoin.
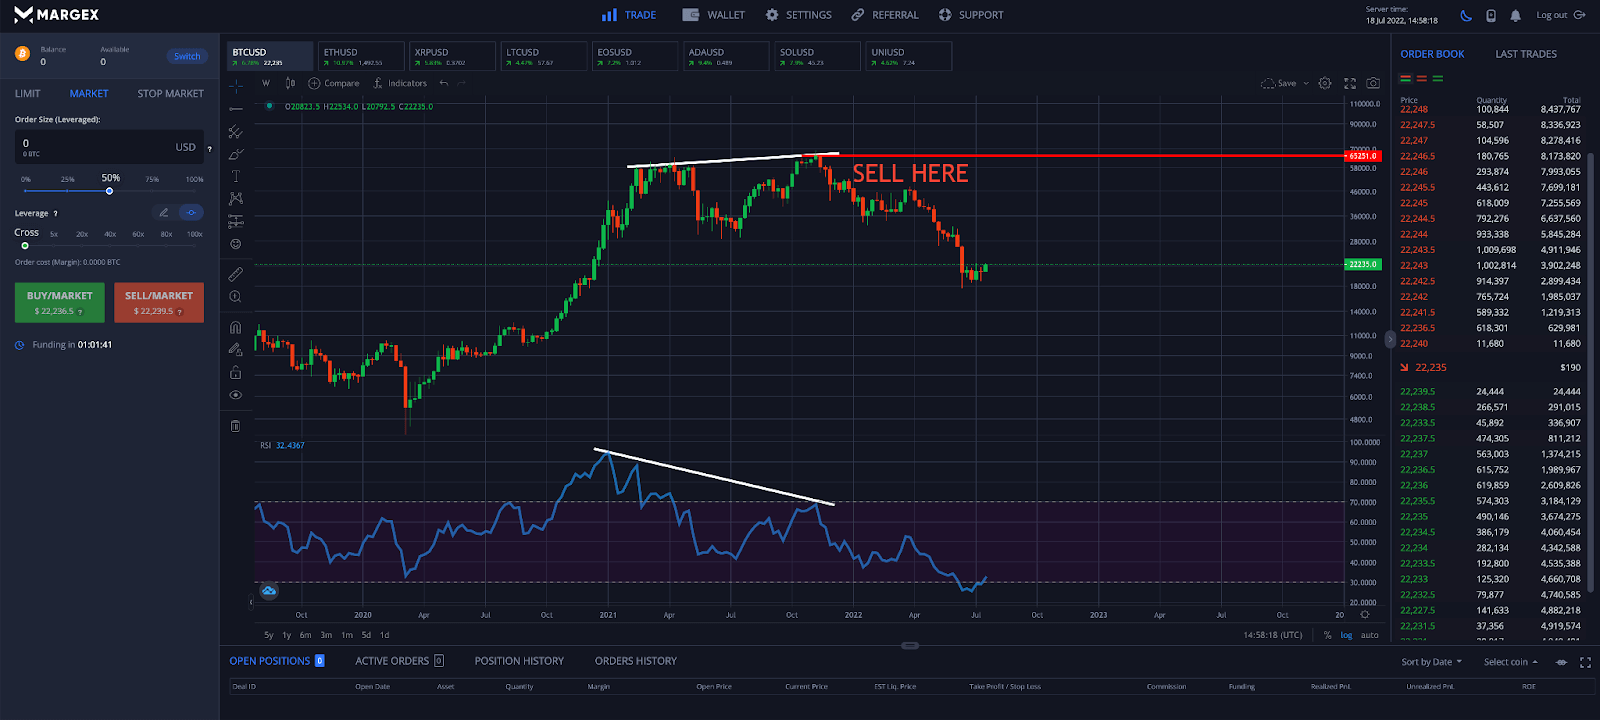
Step 3 – Placing a stop loss above the closing price of the highest peak can protect the trader against significant loss if the trade doesn’t go as planned and the market keeps moving higher.
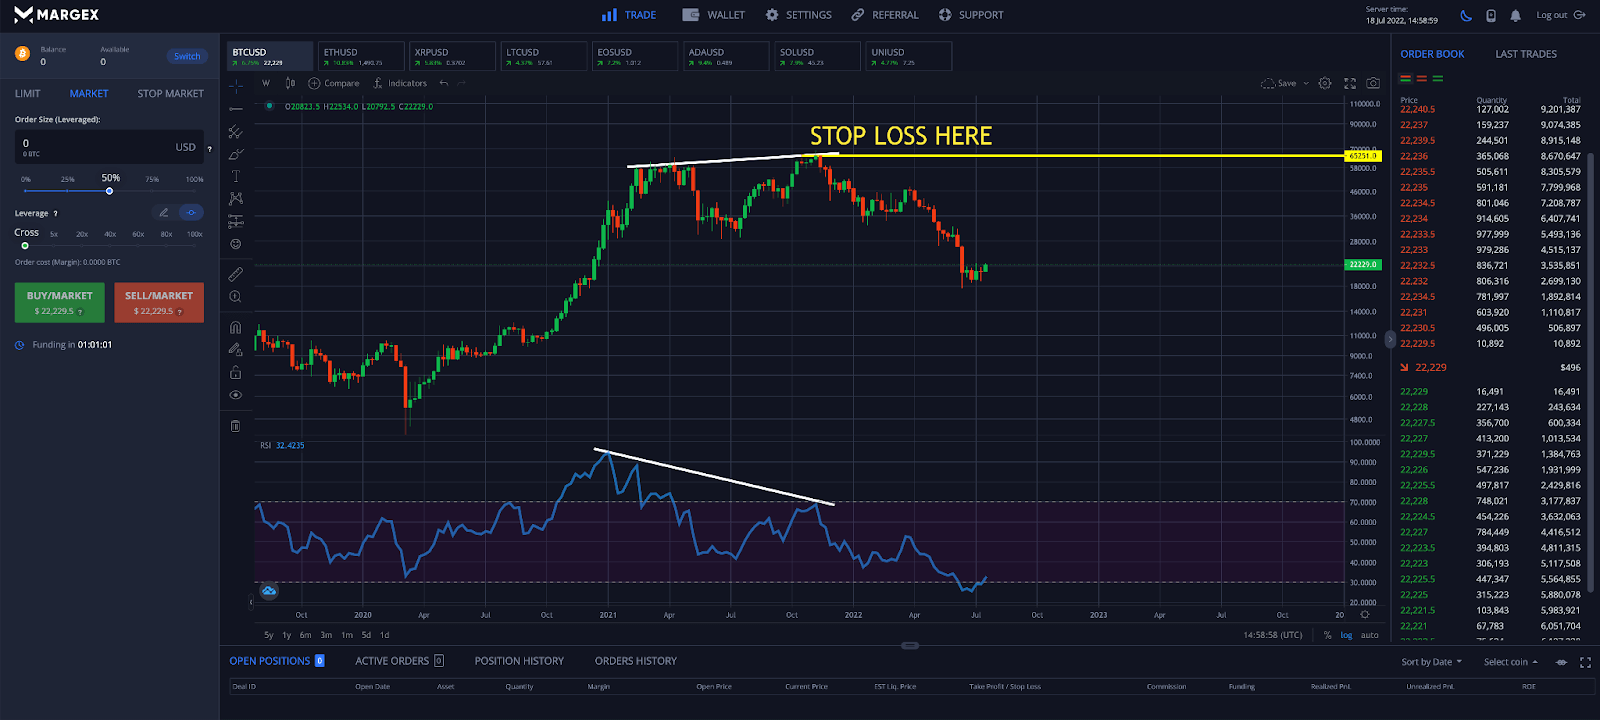
Step 4 – With the trade active, anticipating key levels to take profit is the best way to keep profits and avoid losses. Knowing which levels to take profit at in advance can help to remove any emotion from trading. Remember to stick to the plan!
After closing the trade, profits are booked to a secure Margex cryptocurrency wallet.
FAQ
Bearish and bullish divergences, both hidden and regular, can be challenging to spot. Here are some commonly asked questions about how to trade divergences.
What is a bearish divergence?
A bearish divergence takes place when the price of an asset moves up and makes a higher high, while an accompanying technical indicator such as the RSI makes a lower high.
What is a bullish divergence?
A bullish divergence takes place when the price of an asset moves down and makes a lower low, while an accompanying technical indicator such as the MACD makes a higher low.
Is the bearish divergence a good trading signal?
A bearish divergence whether it is a regular or a bearish hidden divergence pattern can produce a powerful reversal or continuation signal and should not be ignored.
Is the bullish divergence a good trading signal?
A bullish divergence whether it is a regular or a hidden divergence pattern can produce a powerful reversal or continuation signal and should not be ignored.
Does the RSI divergence work for crypto?
RSI divergences work in crypto just as well as they do in other markets, if not more so due to the extreme price movements reaching oversold and overbought conditions. RSI divergences also work for commodities, stock indices, forex, and more.
What is the best indicator for identifying a divergence?
The best indicator for identifying a divergence is the Relative Strength Index. Other popular tools include the Fisher Transform, On-Balance Volume, Stochastic, MACD, and many more.
How do you identify a bearish divergence?
A bearish divergence chart pattern is identified as an asset price making a higher high, while the associated indicator makes a lower high, showing underlying weakness.
How do you identify a bullish divergence?
A bullish divergence chart pattern is identified as an asset price making a lower low, while the associated indicator makes a higher low, showing underlying weakness.
What does a bearish divergence look like?
A bearish divergence is identified by drawing a trend line across two of the most recent peaks on both price and a technical indicator. If there is a discrepancy between the two in terms of the direction or strength of the movement, there is a divergence.
What does a bullish divergence look like?
A bullish divergence is identified by drawing a trend line across two of the most recent valleys on both price and a technical indicator. If there is a discrepancy between the two in terms of the direction or strength of the movement, there is a divergence.
What happens after bearish divergence?
After a bearish divergence, there is often a trend change in the opposite direction of the move that led to the divergence.
What happens after bullish divergence?
After a bullish divergence, there is often a trend change in the opposite direction of the move that led to the divergence.
What is the difference between hidden and regular divergence?
The main difference between a hidden and a regular divergence is the outcome of the movement. A hidden divergence will produce continuation of the primary trend, while a regular divergence produces a trend reversal.
Can bullish and bearish divergences fail?
Bullish and bearish divergences can fail, so it is important to examine the rest of market conditions and search for supporting confirmation from other indicators, chart patterns, volume, and more.
What are the best technical indicators to use for bearish and bullish divergences?
The best technical indicators to use to find and trade bearish and bullish divergences are the Relative Strength Index, MACD, On-Balance Volume, Stochastic, and the Fisher Transform.
Why trade divergences?
Trading divergences are especially helpful because they can help to predict price movements before they occur, allowing a trader to take a position ahead of time and prepare to protect against risk using a stop loss. Trading divergences lead to less overall losses and a higher chance for increased profitability.


