
Technical analysis patterns come in various shapes and sizes, with some being more bullish or bearish, while others are neutral. Few trading patterns are as easy to identify and trade as the rising wedge pattern.
The rising wedge chart pattern is a bearish pattern, but does occasionally break up to keep traders on their toes and guessing. Certain characteristics that fit the profile of a bearish rising wedge pattern can help traders and analysts validate the pattern and increase the probability of success.
Still, no chart pattern is reliable all the time. This guide will provide examples of a rising wedge in an uptrend and a rising wedge in a downtrend, along with how to trade them. We’ll also provide tips on how to prepare for the rare event where a rising wedge has a bullish breakout.
What Is A Rising Wedge Pattern And How Does It Work?
The wedge is a triangle-like pattern where a resistance and support line rise or fall to converge into the shape of a wedge. The rising wedge pattern is the former, which is typically associated with downtrends and bearish results.
The two converging lines will further confine the price action until there is a bearish breakdown or bullish breakout. A valid rising wedge should contain at least five touches of the two trendlines, with two touches of one trend line, and three of the other. Volume declines throughout the duration of the pattern.
Typically, price breaks down through the support trend line with an increase in trading volume. A trader can take an entry at the break of the support line or wait for a potential throwback.
The rising wedge is also called an ascending wedge pattern. Rising wedges are most often of the converging type, not to be confused with the ascending broadening wedge (also called an expanding wedge pattern). In a rising wedge, the low prior to the wedge formation is the minimum target to take profit. Rising wedges have a throwback and pullback rate of as much as 72%, meaning there is a return to the trend line before the follow-through move to the target.
Alternatively, measuring from the height of the highest peak of the pattern to the low point of the lowest dip and applying the measurement from the point of breakdown can provide a more aggressive profit target.
The sentiment exhibited during the formation of a rising wedge is that the market believes an uptrend may be forming as prices increase during the pattern. Each retest of support is increasingly bought up and prices push higher in a tightening pattern. When the pattern breaks down, the increase of selling takes buyers by surprise and stops out orders placed on the way up. This causes rising wedges to produce a notoriously sharp movement when the price eventually breaks down.
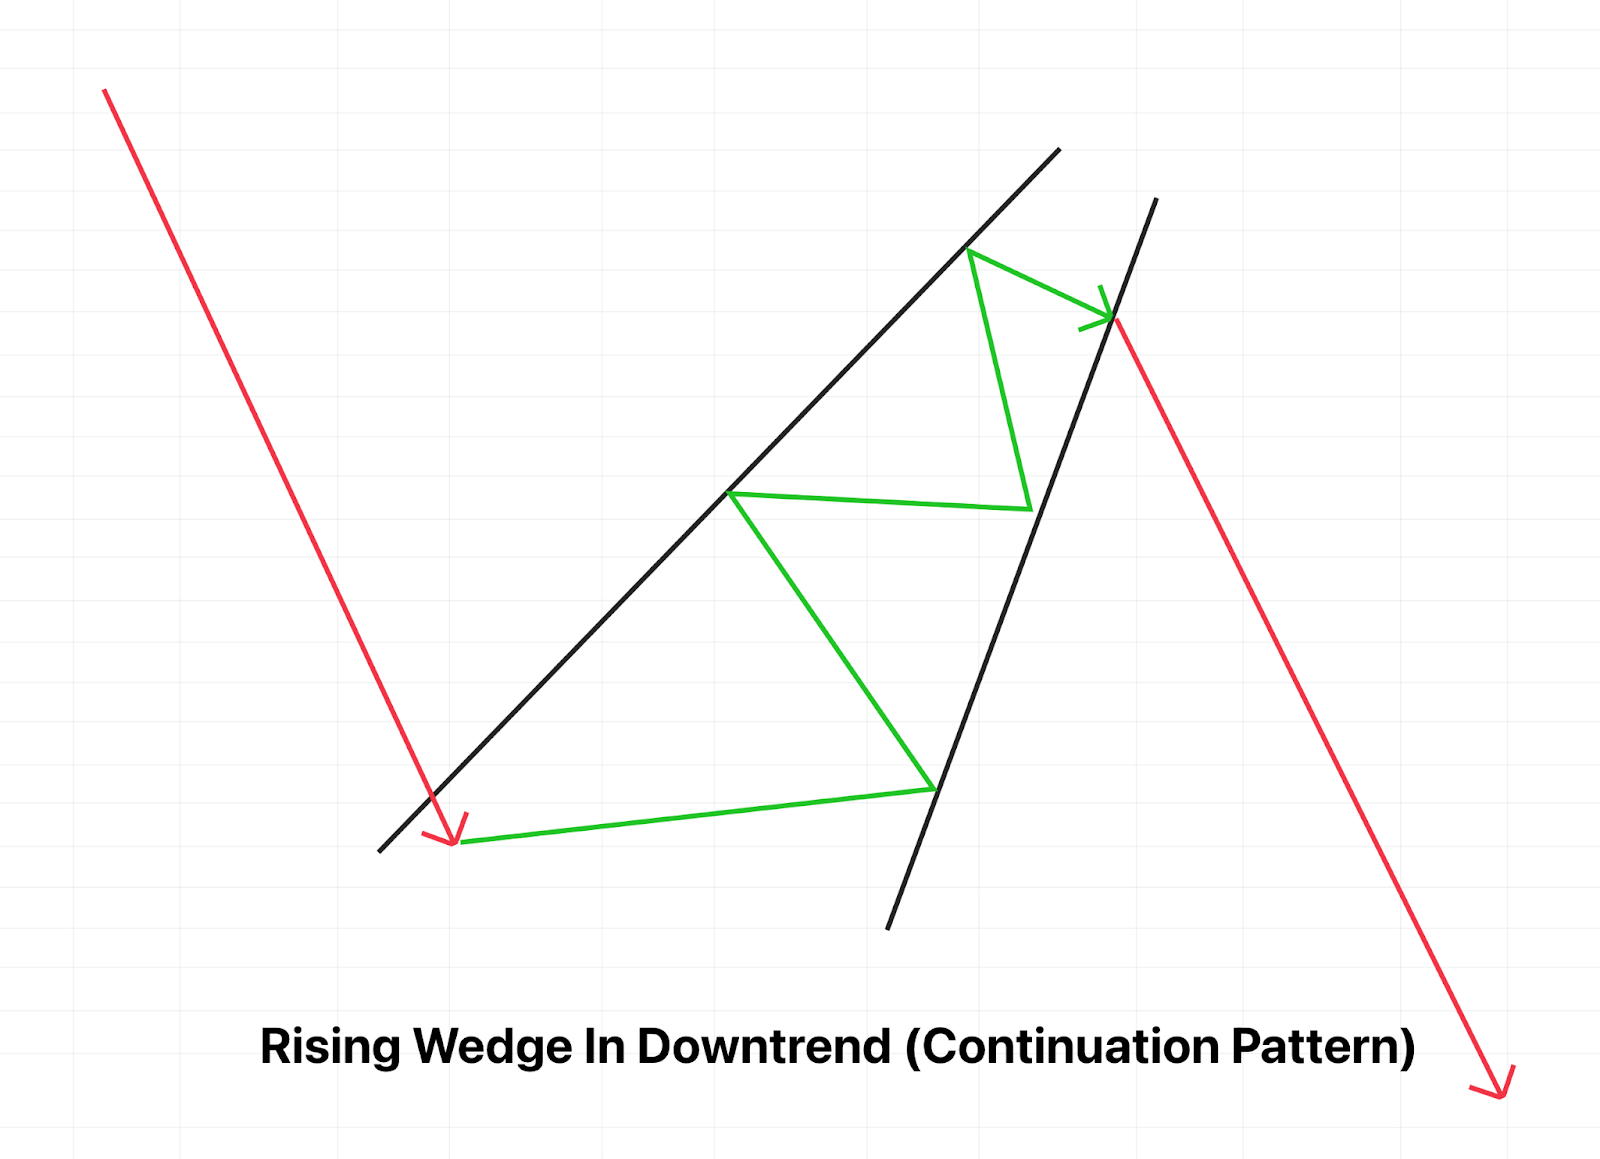
How To Identify The Rising Wedge In Downtrend (Rising Wedge Continuation)
In a rising wedge continuation pattern, the previous price movement must have been down. The bear wedge pattern creates yet another possible selling opportunity once price breaks through the bottom side of the wedge. A short position in the market allows the trader to profit from a continuation of the downtrend.
A rising wedge can be identified when prices start to converge and rise. Both support and resistance will climb in the same direction, bouncing back and forth between each part of the wedge for a certain period of time, and will eventually lead to a break down and an ideal place to place a sell order or short entry.
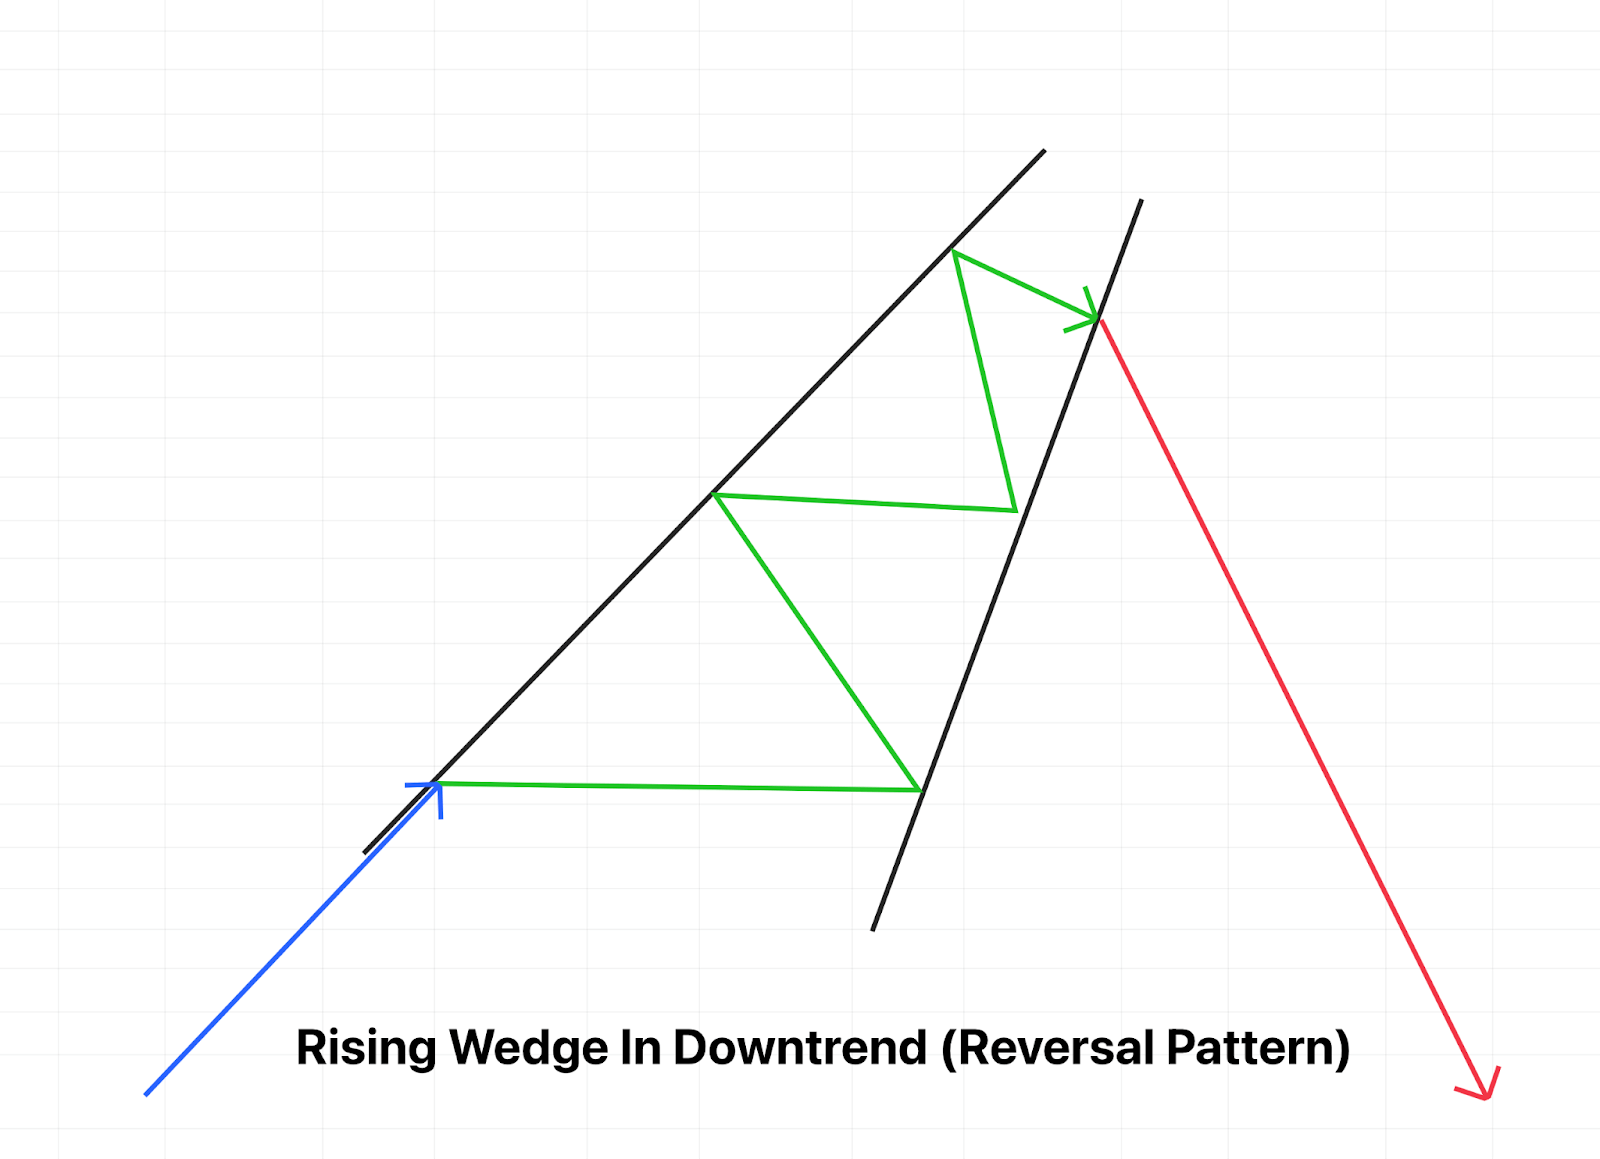
How To Identify The Rising Wedge In Uptrend (Reversal Pattern)
In a rising wedge reversal pattern, the previous price movement must happen from below before prices begin to consolidate and converge into a wedge shape.When the resistance and support trend lines begin to converge, there is a chance for a market reversal, creating a potential selling opportunity.
The appearance of a rising wedge reversal can indicate a reversal of the uptrend and shift in momentum from bullish to bearish. Placing a stop loss above the resistance trend which forms the back of the wedge and above the point of breakdown could result in a successful trade.
What Is The Difference From A Falling Wedge Pattern?
A falling wedge pattern is the bullish analogue of the bearish rising wedge chart pattern. The falling wedge differs in its shape from the rising wedge as well as the results produced. The falling wedge will have two converging trend lines that slope downward, before an upward bullish breakout. On rare occasions, a falling wedge pattern can break down in a bearish direction.
Is A Rising Wedge Bearish Or Bullish?
Investing and trading in financial instruments requires proper assessment of the direction of the market and the ability to carefully forecast which direction the market may be heading. Once a side is chosen, it makes the investor or trader bearish or bullish.. Bulls get the name from goring upward with their sharp horns, while bears swat downward with their fierce claws.
Although the pattern is commonly considered a bearish chart pattern, there have been instances of a rising wedge breakout to the upside. This type of bullish rising wedge could be another type of chart pattern, called a leading diagonal.
What Is The Difference From A Diagonal Elliott Wave Pattern?
Over the years, different analysts have seen the same formations and patterns as different things and have as such, given them different names. In Elliott Wave Theory, there is no such pattern known as rising wedge. The only common pattern found between Elliott Wave and other methodology is the triangle. Otherwise, Elliott Wave Theory identifies patterns as zig-zags, flats, impulses, or in the case of wedges, something called a diagonal.
Diagonals can form in expanding or converging shapes. They can also appear at the beginning of a new trend as a leading diagonal, or the end of a trend as an ending diagonal. A leading diagonal would appear very similar to a rising wedge in form and in characteristics, with the only difference that the breakout occurs upward at the opposite side of the wedge.
Trading The Rising Wedge In The Crypto Market
The Margex trading platform includes powerful technical analysis tools built directly into the platform. This allows traders to properly identify and successfully trade a rising wedge pattern. Here are the steps necessary to trade the pattern.
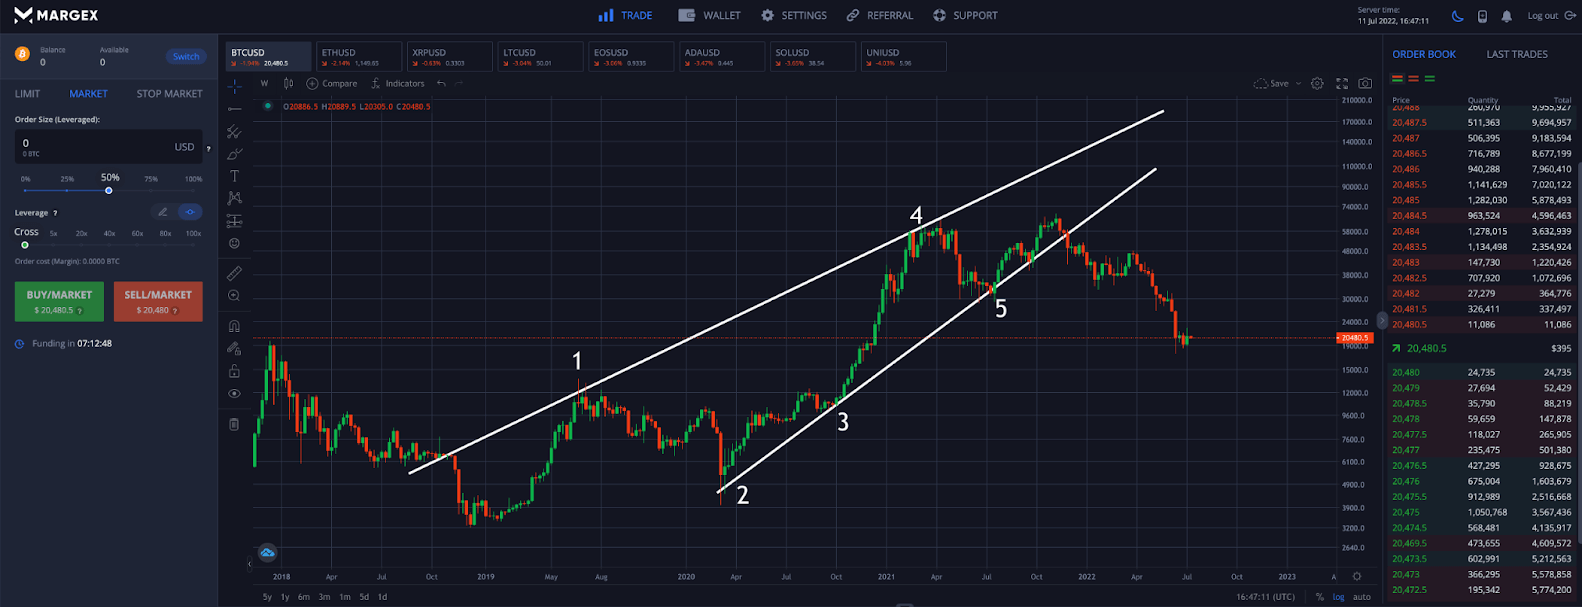
Step 1: First, you must identify the rising wedge chart pattern, finding a minimum of 5 touches of the two trend lines. To do so, draw an ascending trend line below each support level and a rising trend line along key resistance levels. The result should be a converging wedge shape.
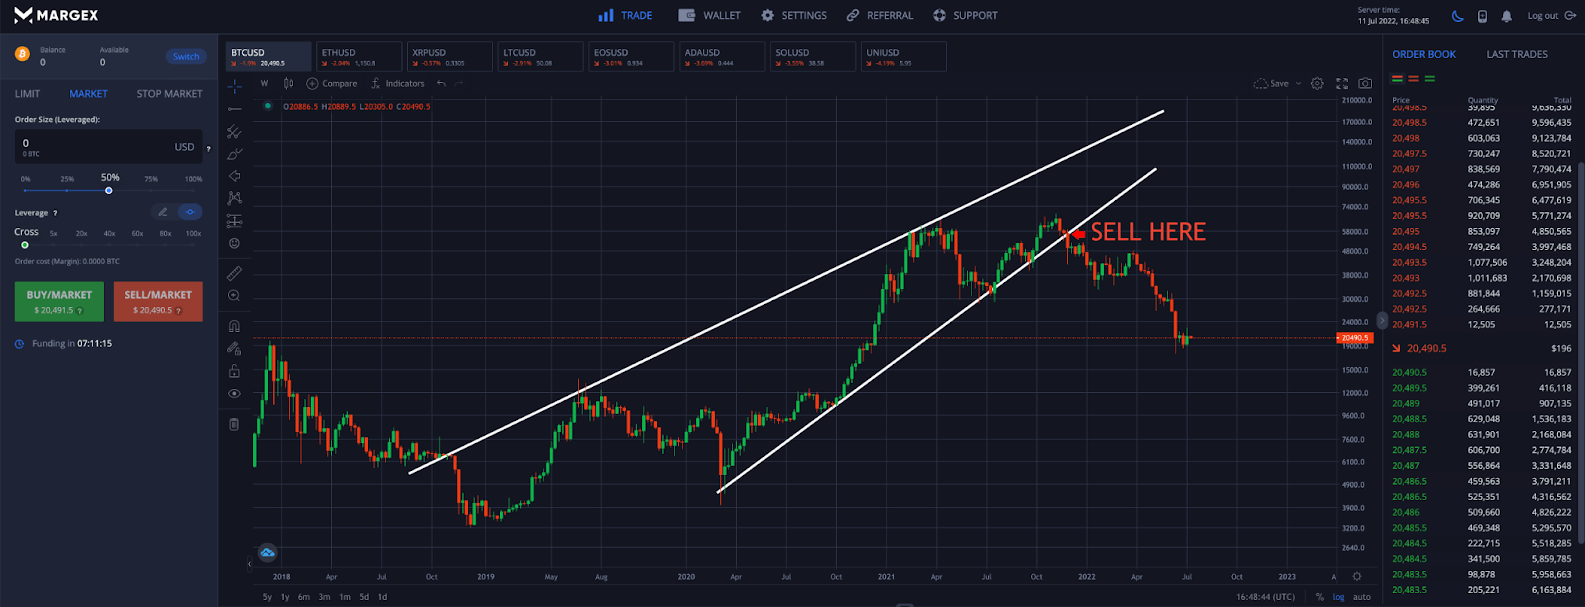
Step 2: Patience is required. Traders will want to wait for a decisive breakdown of the wedge pattern with high volume. A sell order can be placed just below the trend line so when the price breaks down violently, the sell order is triggered and the position has a high probability to be successful.
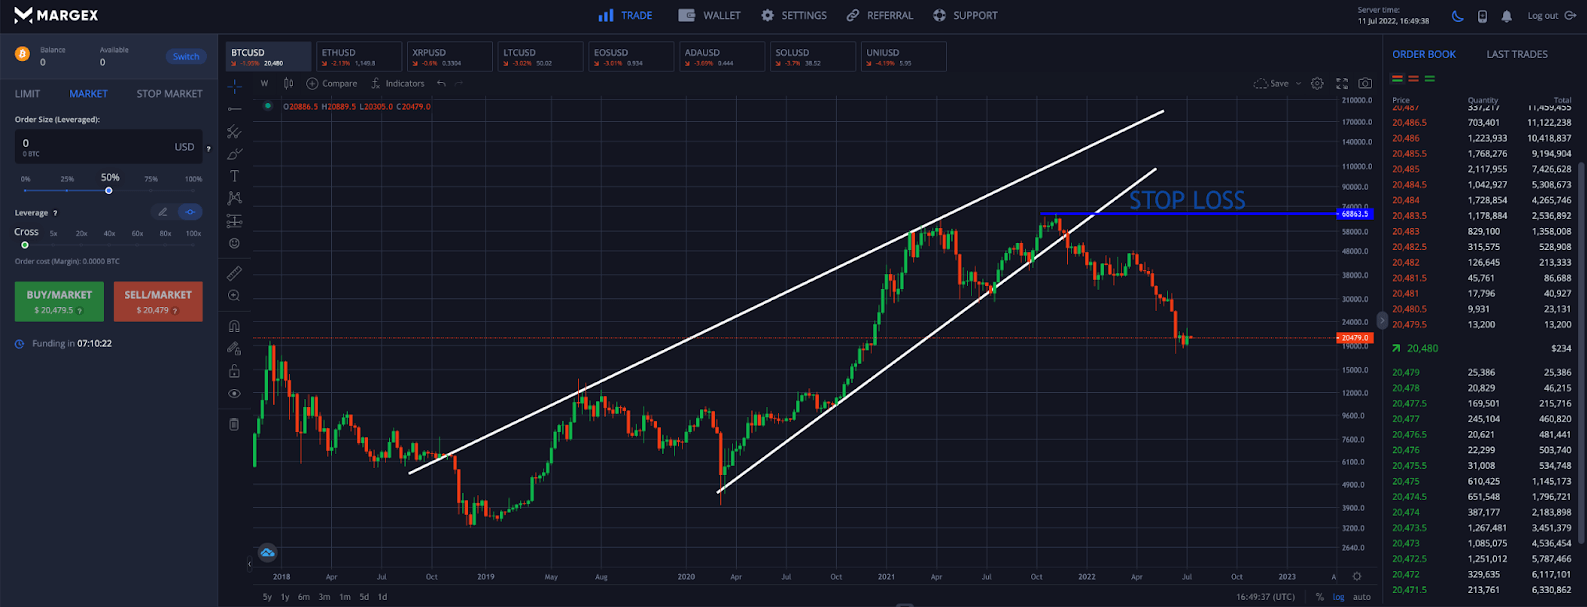
Step 3: It is imperative to place a stop loss to prevent any unwanted drawdown if the market goes against the position. Typically, a trader would place the stop loss above the high point before the break down before support. Alternatively, traders can wait for a throwback to support turned resistance for a safer entry.
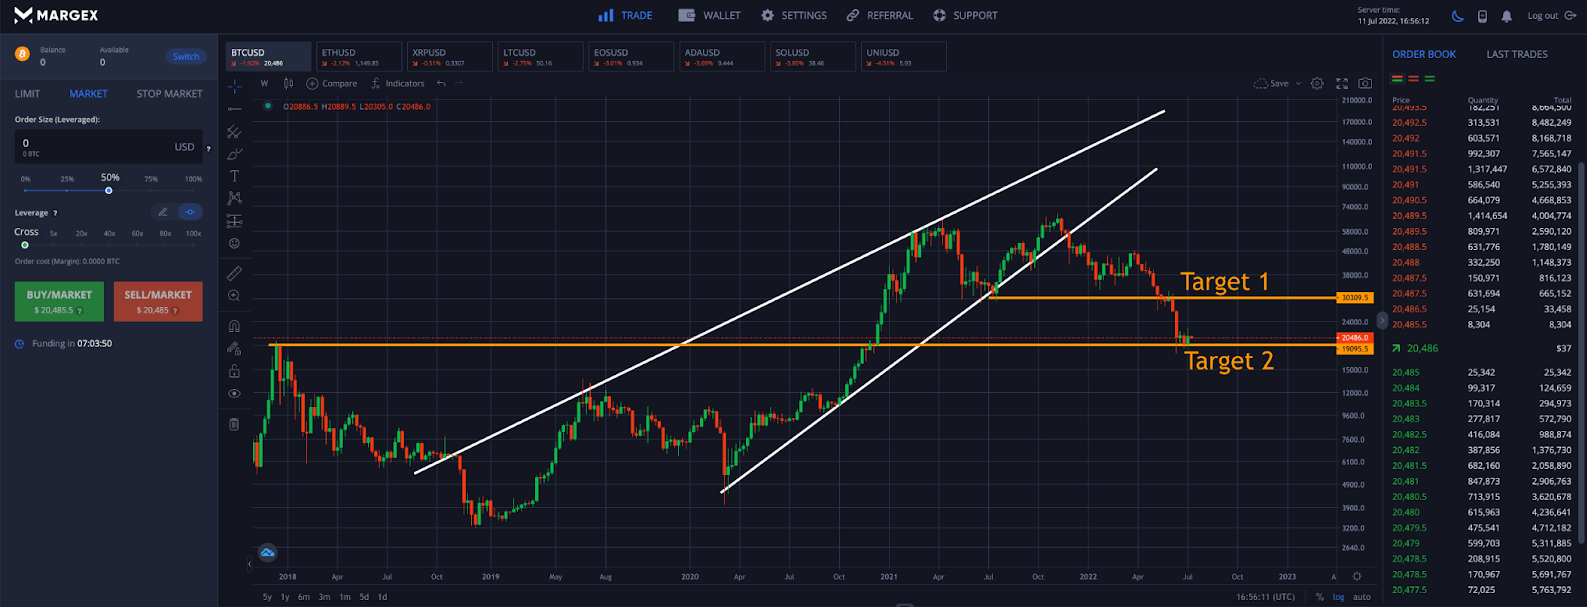
Step 4 – Take profit at predefined levels. Traders can set up a more conservative price target or a more aggressive price target depending on their confidence level in the setup and resulting breakout.
FAQ
The rising wedge pattern is a common technical analysis chart pattern, known for its bearish breakdowns in both uptrends and downtrends. However, not all rising wedges are bearish and certain conditions must be met in order for the pattern to be valid. Rising wedges are only confirmed after a breakdown.
Because there are also broadening wedges, falling wedges, triangles, and diagonals, we have created this FAQ to help solve any remaining answers.
What is a rising wedge?
A rising wedge chart pattern is a bearish technical analysis pattern that typically breaks down regardless of if it is forming in an uptrend or a downtrend. A rising wedge can break bullish in rare circumstances. A rising wedge results in a strong move down and is one of the most common patterns in crypto trading.
What are some other names for a rising wedge pattern?
Other names for the rising wedge pattern include the ascending wedge or the diagonal. In Elliott Wave Theory the leading diagonal will break bullish while the ending diagonal will break bearish. There is also something called an ascending broadening or rising broadening wedge. However, the patterns are not related.
What happens after a rising wedge pattern completes?
After a valid rising wedge completes, either an uptrend has ended or a downtrend is set to continue. Either way, because of how positions are built during the pattern, when it ultimately reverses all of the new positions created on the way up are stopped out in combination with new positions being taken on the short side. The result is a strong, sudden, and sharp movement.
How do I find a rising wedge pattern in a chart?
A rising wedge pattern in a chart can be found by drawing a trend line of support below rising price action, and finding a corresponding resistance trend line that travels in the same direction, albeit at a slightly different degree of angle. The two trend lines should converge, with price action each trend line a two to three times each for a total of five touches to be valid.
Is a rising wedge bearish or bullish?
A rising wedge is almost always bearish, however, in certain conditions a rising wedge can break bullish. For example, if the pattern becomes too obvious to the market, a crowded trade could provide the opportunity for a short squeeze and a large rally.
Can a rising wedge break up?
Much like any bearish chart pattern, there is always the potential for an upside breakout and market confusion. Failed or broken patterns tend to cause a large reaction in the opposite direction than what was expected. Because of the confusion and surprise, the resulting move can be particularly strong.
Is the rising wedge pattern a continuation pattern or a reversal pattern?
The rising wedge pattern is both a reversal and a continuation pattern. The difference is whether the pattern occurs during an uptrend or a downtrend. Rising wedge pattern in an uptrend is a reversal sign, while a rising wedge pattern in a downtrend is usually a continuation pattern.
How do you find the target of the rising wedge?
To find the target of a rising wedge, traders can take profit when price reaches the low point where the pattern first began to form, or at various support levels on the way down. Another way to find a target is to measure from the highest peak to the lowest valley, then apply the measurement to the point of breakdown.
Why does a rising wedge form in the market?
A rising wedge represents a short term consolidation phase where the market believes to be in a bullish trend. During the rise up, prices ricochet between two ascending trend lines, until the lower support line breaks down and a large move ensues. The short burst of bullish sentiment is quickly shredded by bears into panic and fear.


