
Bitcoin (BTC) is trading just above $58,000 on Monday after experiencing a 3.6% decline on Sunday. Last week, Bitcoin exchange-traded funds (ETFs) in the US saw average outflows of $160.10 million. On the other hand, on-chain data suggests potential negative trends, indicating a possible bearish outlook.
According to a report by TASS, Russian President Vladimir Putin has signed a law legalizing cryptocurrency mining in Russia. Key ideas in the new law include digital currency mining, mining pools, and mining infrastructure operators. It reorders mining operations as part of turnover instead of creating digital money.
In a recent government conference, President Putin underlined the need to create a legal framework for digital currencies, emphasizing their possible contribution to Russia’s economic growth and the need for appropriate control and infrastructure.
According to the cybersecurity group VE Sin Filtro, Venezuela has banned access to the cryptocurrency exchange Binance and other online platforms during national demonstrations over the contested election results.
🚨 Bloqueado Binance en CANTV 🚨
Esta noche detectamos un bloqueo DNS al exchange de criptomonedas @Binance, el cual afecta el normal funcionamiento de su web y su aplicación móvil.
El bloqueo fue detectado por primera vez a las 8:15 PM de hoy #9Ago pic.twitter.com/aivmVT2VNi
— VE sin Filtro (@vesinfiltro) August 10, 2024
The official Latin America account of Binance on X verified this fact on Saturday. However, the Venezuelan government has not released an official statement on this move or suggested a course of action for the possible resolution of the matter.
Following a drop last Monday, Bitcoin exceeded $62,600 on Thursday, showing a 25% rise in just over three days. As usual, this quick action startled many regular traders.
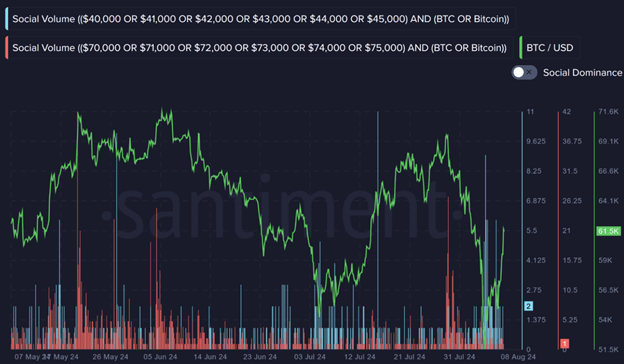
Social media searches also show a dramatic increase in interest as conversations about hypothetical Bitcoin values ranging from $70,000 to $75,000 imply that Bitcoin might have achieved a likely local price high.
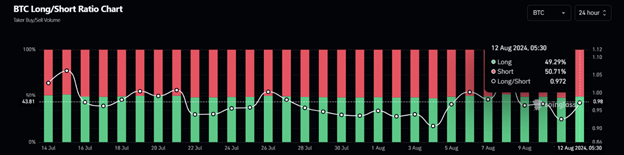
According to data from Coinglass, Bitcoin’s long-to-short ratio currently stands at 0.972. This below-one ratio indicates a prevailing bearish sentiment in the market, with more traders predicting a decline in Bitcoin’s price.
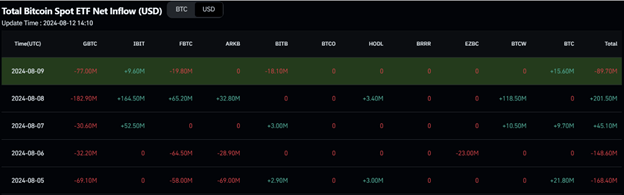
In addition, recent figures from Bitcoin Spot ETFs reveal total outflows of $160.10 million over the past week. Observing the net flow data of these ETFs is essential for grasping market dynamics and investor sentiment. The total Bitcoin reserves held by the 11 US spot Bitcoin ETFs have reached $48.81 billion.
BTC Eyes Short-Term Rally Amid Persistent Downtrend Pressure
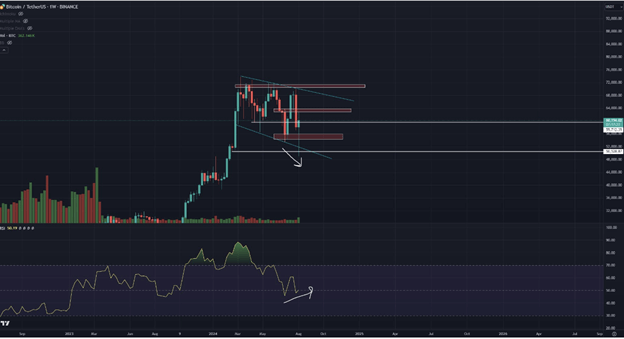
Derived from the swing high of $70,079 on July 29 and the low of $49,101 on August 5, Bitcoin’s price has regularly faced opposition at the 61.8% Fibonacci retrace level of $62,066. At $58,659, Bitcoin is trading just 0.1% lower.
If the $62,066 level remains resistant, supported by the broken trendline and the 100-day exponential moving average around $63,021, enhanced selling pressure might be expected.
If Bitcoin fails to surpass the $62,066 level, it might drop by about 19%, pushing it closer to the daily support level of $49,917.
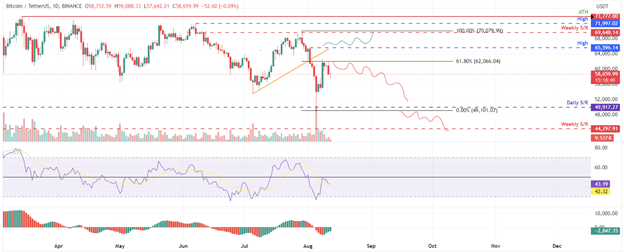
The Relative Strength Index (RSI) and Awesome Oscillator (AO) on the daily chart are trading below the neutral thresholds of 50 and zero, respectively, indicating a prevailing bearish sentiment.
Conversely, if Bitcoin closes above the August 2 high of $65,596, it would create a higher high on the daily chart. This could lead to a 6% increase in price, positioning Bitcoin to test the weekly resistance level at $69,648.
Why Bitcoin Could Reach $74K Before 2024: Insights and Predictions
Several technical indicators, including price momentum divergence, the development of a Doji candlestick, and other positive patterns, point to a slowing down in Bitcoin’s recent decline.
Source: Roman
Following a notable plunge of almost 25% on August 5 during the global market crisis, there are growing indications that this dip might be a bear trap. These signals suggest that the price of Bitcoin could be on the way to setting new record highs in 2024.
Weekly graphs show evidence of a positive divergence in Bitcoin’s price. The weekly relative strength index (RSI) has generated lower lows even when Bitcoin’s price has declined since July. This difference implies an upward turnaround is imminent since the downward momentum is fading.
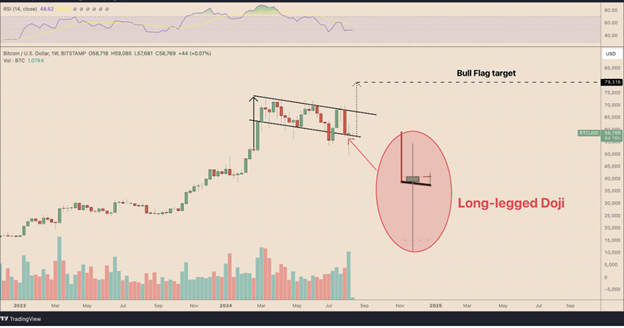
Confirming these positive indications with other technical indicators will help guarantee their accuracy. Bitcoin also developed what looks to be a long-legged Doji candlestick last week. Following a strong trend, this pattern usually indicates a possible reversal or at least a brief stop before the trend starts again.
Bitcoin Whales Ramp Up Accumulation
Combining the development of a Doji candlestick with higher trading volumes close to the lower trendline of the bull flag pattern points to strong trader conviction for a possible price comeback. By September, this suggests that Bitcoin might gather near the top trendline of the flag—about $66,500.
Source: Glassnode
Usually, bull flags are seen as patterns of bullish continuance. With the price maybe climbing by the same amount as the previous uptrend before the flag formed, a decisive closure above the upper trendline might set off a rally.
All things considered, the alignment of the bull flag, Doji candlestick, and bullish divergence points to a price for Bitcoin that might top $79,000, establishing a new record high in the next months.
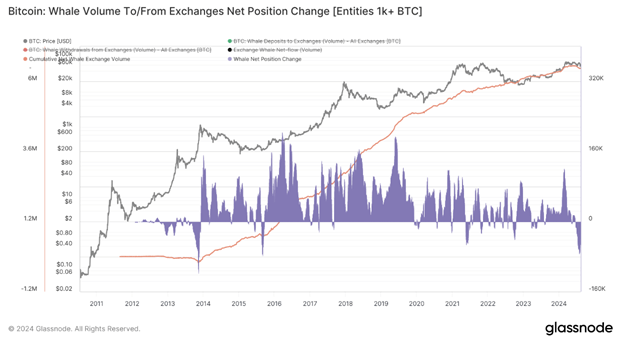
Furthermore, on-chain statistics from Glassnode, which monitors the activity of “whales,” support Bitcoin’s positive reversal signs. Since 2015, Bitcoin whales carrying at least 1,000 BTC have lately withdrawn the most from exchanges, signifying the most significant increase in almost a decade. Over the last thirty days, about 73,350 BTC has been taken off whale exchange balances.
Bond Traders Predict September Rate Cut with Absolute Confidence
Macroeconomic data are improving the positive reversal perspective of Bitcoin.
CME data as of August 12 shows perfect certainty that the Federal Reserve of the United States will lower its benchmark interest rate in September. Rising from 15% a week ago, the probability of a 25 basis point (bps) rate cut is now 51.5%. The remaining chance points to a 50 bps rate reduction, which would be a favorable indication for Bitcoin.

Examining the Federal Reserve’s interest rate path is crucial this week since August 14 will see the publication of the US producer and consumer pricing data for July. Any rising inflation indicator could discourage Fed Chair Jerome Powell from hiking rates in September, negatively affecting Bitcoin and the larger cryptocurrency market.
Reflecting increased concern about the August 14 inflation report, the crypto market opened the week in an impasse between optimistic and bearish forces. Fed Governor Michelle Bowman’s recent hawkish remarks, expressing her disapproval of a rate drop for the forthcoming September meeting, add to this uncertainty.
Decline in Whale Demand for Bitcoin Amounts to $34 Billion
On-chain data recently shows a bearish trend in Bitcoin. The behavior of whale investors has strayed from past norms, implying that the latest Monday morning rejection of Bitcoin around $60,000 would indicate a protracted correction period.
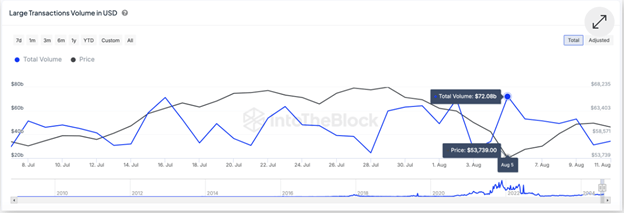
Based on the Large Transactions chart of IntoTheBlock, which tracks whale investor activity during important market events, demand from big institutional investors has dropped noticeably. According to the graphic, Bitcoin whale transactions dropped from $72.08 billion to $34.29 billion between August 5 and 11.
This $34 billion decline in whale demand happened even if the price of Bitcoin rose to 27% within the same period. The lack of significant whale support for this rally helps to explain why Bitcoin faltered in keeping its upward pace and encountered opposition at the $62,000 mark over the weekend.
As Bitcoin’s price is below $59,000 as of Monday morning, additional downward volatility is likely, particularly should whale demand remain low.
All things considered, Bitcoin may have a challenging week ahead. Declining whale demand and negative technical indications point to a potential fall towards $55,000. As the market changes, investors should use prudence and closely check important resistance and support levels.


