
Ethereum has experienced a nearly 3% decline this Monday amid falling institutional interest, diminished trading volumes, and a drop in transaction counts. The cryptocurrency also struggled to breach a significant resistance level in its price trajectory.
This downturn was further reflected in the U.S. Ethereum ETFs, which reported a net outflow of $44.5 million last week, marking a seventh consecutive day of negative flows. Although there were slight inflows into the “new eight” ETFs, these were overshadowed by a substantial $118 million outflow from Grayscale’s ETHE.
Ethereum’s Major August Decline
The market’s poor response continued, and Ethereum only gained 3% over the past week. To make things even more complex, the Ethereum Foundation was said to have sold around 35,000 ETH last Friday when the market was temporarily rising.
On the other hand, Bitcoin ETFs have had seven days of net inflows, while Grayscale’s GBTC has had similar withdrawals. This suggests that institutional investors may be moving away from Ethereum. The market still hopes that the Federal Reserve will lower interest rates, which is why this change happened.
The future for Ethereum is even worse now that trading volumes and transaction counts on the blockchain have dropped a lot in August. A report from The Block says that the average daily trade volume for top Layer 1 fell from $6.56 billion on July 26 to just $2.9 billion by Monday.
Also, the number of transactions on Ethereum dropped to 27.27 million in August, which is the lowest number since May 2020, and there are still five days left in the month. This price drop adds to a general trend of investors being cautious, which happens often in the summer.
However, David Duong and David Han, two analysts at Coinbase, said that the drop in Ethereum activity this August was better than it had been in previous years. This is a positive sign despite the current market problems. The analyst added:
“The decrease in ether trading volumes in August compared to the preceding three months has been a modest 7.7%, compared to the average 16.8% decline observed over the last five years.”
Ethereum Technical Analysis
Ethereum’s trading value slumped about 3% to settle at $2,690 on Monday. The cryptocurrency saw notable market activity yesterday, selling ETH valued at $30.4 million. Of this, $2.15 million were short positions, and $28.25 million were long position liquidations.
Over the weekend, the digital currency had temporarily risen; on Saturday, it touched a resistance level of $2,817, its highest point since the market collapse on August 5. The gains were fleeting, though, as Ethereum dropped from its highest point.
A long-leg Doji candle emerged throughout the trading session and indicated possible traders’ uncertainty. This trend usually points to a likely price or trend reversal, a suspicion validated by the later price drop after the candle’s creation.
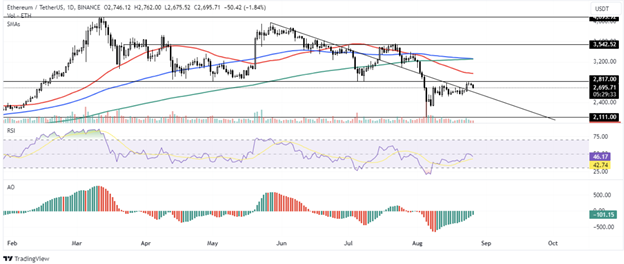
Based on the most recent chart analysis, Ethereum (ETH) has remained in a noteworthy price range. Currently trading just below a critical resistance level, ETH could recover a significant support zone maintained for almost half a year by closing above this barrier on the daily chart. Ethereum may enter another significant trading range and move toward the $3,542 barrier level if it surpasses this.
With the next notable obstacle set around $4,093, Ethereum could move toward its yearly high with further momentum. With this action, ETH may reach a new high. The 100-day and 200-day Simple Moving Averages (SMA) are possible obstacles.
Technically, the Simple Moving Average (SMA) Relative Strength Index has shown signs of recovery after dropping on August 15. A cross above the midline of this SMA could indicate a move towards positive momentum.
Besides, the Awesome Oscillator (AO) has shown narrower green bars starting August 10. A move above zero and continuing this trend would reinforce Ethereum’s prospects of a bullish reversal even more.
Despite these signals, Ethereum might require some time to consolidate before starting a solid climb. Analysts caution that a daily closing below the $2,111 support level would undo this optimistic view.
Solana’s Native Token Remains Stable as PYUSD Hits Milestone
An official statement released Monday said that the Solana network had reached a significant milestone when its PayPal stablecoin, PYUSD, surpassed the $1 billion market value mark. Even with this important change, the price of Solana’s local token, SOL, didn’t change much. It stayed at around $160 on Tuesday.
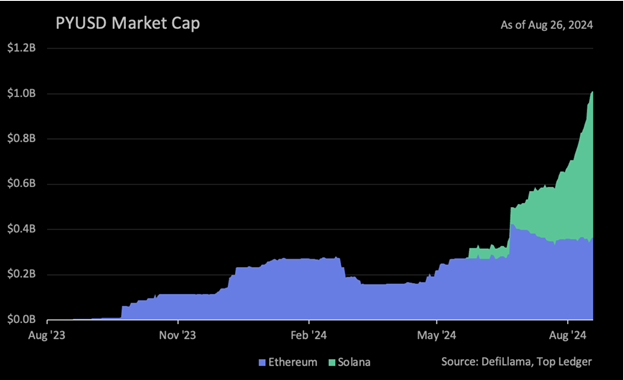
The PYUSD card was first released on Ethereum in August 2023. In May 2024, it was added to the Solana chain as well. It now makes up 64% of the stablecoin’s market share.
Traders see the rise in the PYUSD as a significant accomplishment. The fact that it has a large part of the Solana chain’s retail market shows how much demand there is.
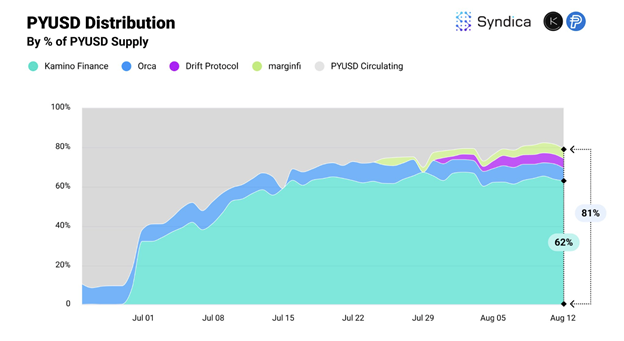
Also, Solana has become the leading blockchain for PYUSD, and token rewards are in place to encourage its use and integration in DeFi protocols, such as Kamino Finance and Syndica.io.
Artemis, a company that studies cryptocurrencies, says that the PYUSD stablecoin works on the Solana network for much less money than Ethereum. The average fee for PYUSD trades on Solana is only $0.001.
Solana Poses Bullish Trend: SOL’s Technical Analysis
Solana (SOL) also seems ready for further increases. It is trading close to $156.92, and analysts estimate an 11.75% growth to a target of $175.39. This projection fits Solana’s Fair Value Gap (FVG), which ranges from $172.91 to $175.39, upper bound.
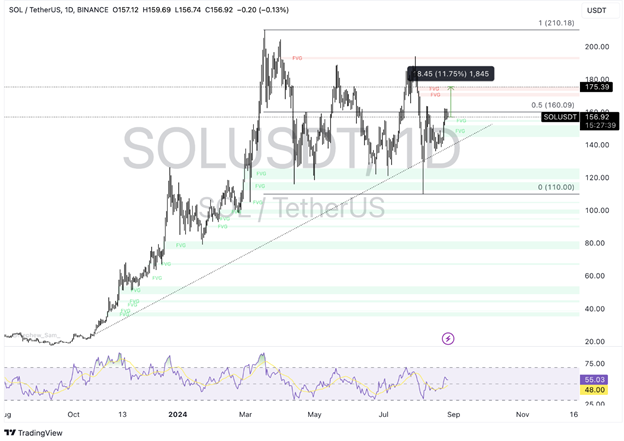
But Solana must first overcome resistance around $160.09, the 50% Fibonacci retracement level of its recent price drop from a March high of $210.18 to an August low of $110.
Key momentum indicators such as the Relative Strength Index (RSI) and the Moving Average Convergence Divergence (MACD) point to strengths supporting SOL’s optimistic view. While the MACD’s green histogram bars above the neutral line indicate continuous positive momentum on the daily chart, the RSI is at 55.48, implying robustness in the present price trend.
If Solana experiences a price correction, the cryptocurrency will likely find support within the Fair Value Gap, which is between $154.08 and $155.25.
What is Happening In XRP?
Early August saw ripple (XRP) lose vital support near the $0.65 mark, leading to sideways trade. Analysts believe several elements, including whale accumulation, XRP supply distribution, and on-chain activity, shape the altcoin’s market behavior.
XRP has only modestly increased 1.12%, steadying close to the $0.60 support level as of the most recent trading session.
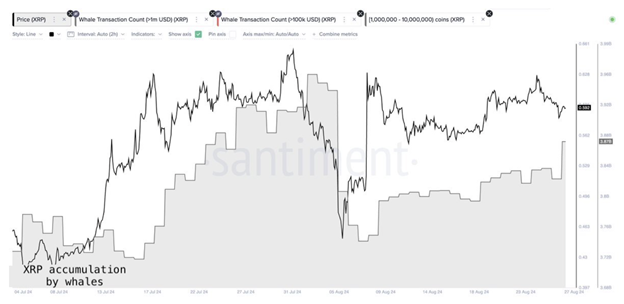
According to Santiment’s data, Ripple whales regularly distributed tokens with about 140 million XRP exchanged between August 19 and August 26. But things started to change in the next few days as these major investors gathered XRP again. Over fifty million XRP were gathered twenty-four hours between August 26 and August 27.
Despite this build-up, whales offloaded around 140 million XRP tokens over seven days, causing Ripple’s price to drop below $0.60.
Market observers note that whale activities often dictate short-term price movements. Accumulation is generally viewed as a bullish signal, whereas distribution tends to increase selling pressure and can lead to price declines, as evidenced between August 19 and August 26.
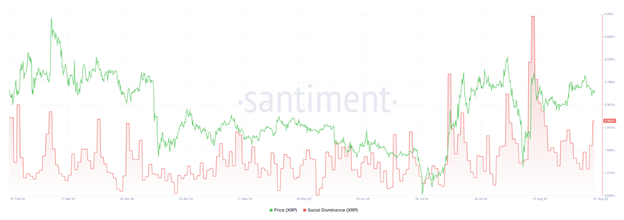
Moreover, according to Santiment, Ripple’s social dominance, an indicator of the frequency of XRP-related discussions on social media platforms, peaked at 2% on August 27. It marks the highest level of social engagement in two weeks, suggesting a growing interest and mindshare among traders and cryptocurrency enthusiasts, potentially setting the stage for future price movements.
XRP Technical Analysis
Based on its performance on the XRP/USDT daily chart, the native coin of the XRP Ledger has been on a multi-month bearish path. The cryptocurrency broke a crucial support level of $0.65 on August 3 and has since faltered in its recovery efforts.
Technical analysis suggests that XRP may aim for a rebound to $0.6439, a significant resistance mark challenged several times in the past fortnight. It would be an over 8% rise from its present trading posture.
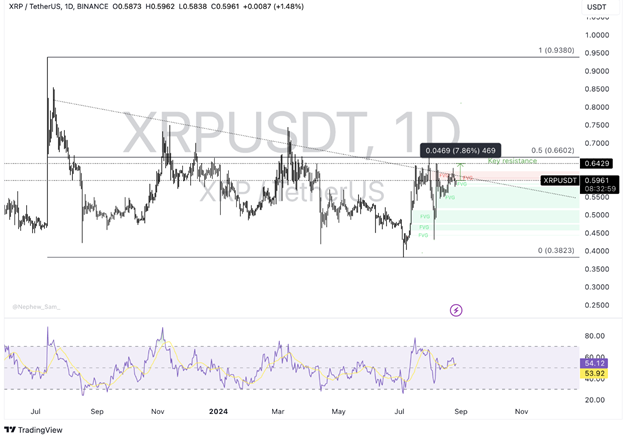
Ripple targets $0.6602, corresponding to the 50% Fibonacci retracing level between the high of $0.9380 in July 2023 and the low of $0.3823 in July 2024. Further upward momentum could support a possible gathering. The daily Relative Strength Index (RSI) shows a moderately positive attitude above 50.
If Ripple faces a correction, it may find support in the price imbalance zone spanning $0.5189 to $0.5785. A more notable drop would force the altcoin to review its August lows at $0.4319, hence maybe triggering fresh checks of support levels.


