
Bitcoin (BTC) remained stable at around $63,000 on Monday. It had found support at a key level the previous week, even though the market has been very volatile lately, with BTC dropping from a high of $65,618 to a low of $59,829.

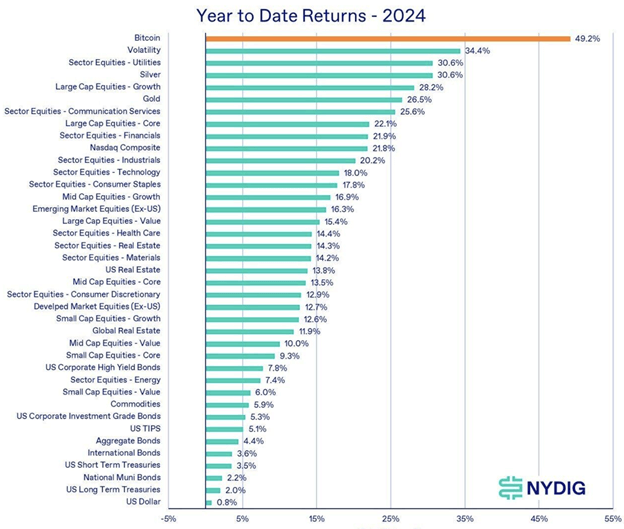
A report from NYDIG shows that Bitcoin is still the best-performing asset of the year, with a 49.2% gain. This comes after week-over-week losses were seen in US spot Bitcoin Exchange-Traded Funds (ETFs).
The Historical Performance of Bitcoin in October
Last week, there was a clear drop in institutions’ interest in Bitcoin. Coinglass data shows that money coming into US spot Bitcoin ETFs dropped sharply, from $1.10 billion in the last week of September to $262.8 million leaving in the first week of October. This major drop in ETF activity shows that institutions are less interested in the most popular coin.
The September US Nonfarm Payrolls (NFP) report came out on Friday. It showed that 254,000 new jobs were created in September, much higher than the predicted 140,000. The unemployment rate also decreased slightly, from 4.2% in August to 4.1% in September, which gave us more information about the overall economy.
In a report released on Friday, crypto asset trading company Capital QCP said that although employment numbers had been weak in previous months, the robust labor data shows that the US economy is still strong.
Historically, Bitcoin has given investors good results in October, with an average monthly gain of 21.01%. This is why it is called “Uptober.” After the price of Bitcoin went above $63,000 on Monday, Coinglass’ chart of Bitcoin’s past monthly returns turned green, giving traders hope for the rest of the month.
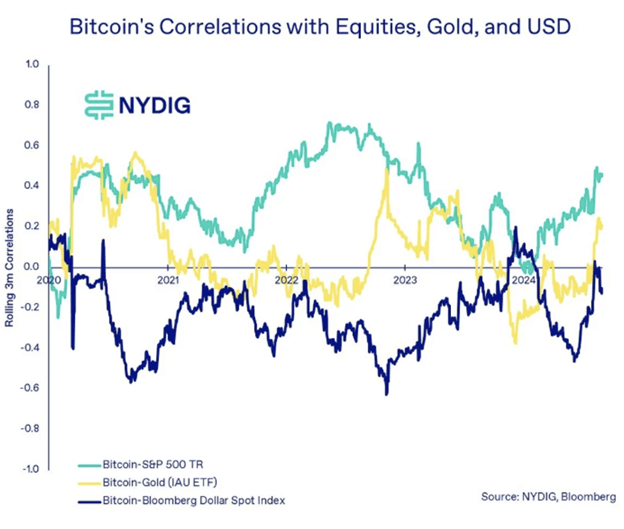
Last week, the New York Digital Investment Group (NYDIG) said that Bitcoin is still doing better than other investments in 2024, with a 49.2% gain. The study also noted that the link between Bitcoin and US stocks grew more vital in the third quarter. By the end of the quarter, Bitcoin’s rolling 90-day correlation with US stocks had reached 0.46.
Even though it went up, NYDIG pointed out that Bitcoin’s correlation with stocks is still pretty low. This shows how valuable it is as an asset that can help balance portfolios of different types of assets. The study warned people not to think of Bitcoin as “leveraged US equities,” pointing out that it has a long-term correlation of only 0.12 with stocks over 90 days.
The study emphasized the importance of the US election on November 5 and how it will likely affect market performance in the fourth quarter.
The report implies a probable change in leadership at the Securities and Exchange Commission (SEC), so a potential Trump triumph might result in more increases in the bitcoin market.
“We anticipate a change in the leadership of the SEC whereby Gensler is replaced by someone more crypto-friendly. Traditionally, Q4 is a joyous time for Bitcoin, so the analysis concluded with multiple catalysts seeing history rhyme.
Technical Analysis: Bitcoin Rebounds from $60,000 Support
Last week, Bitcoin’s price pulled back; on October 2, it found support at the 200-day exponential moving average (EMA) near the $60,000 mark. BTC broke above the $62,125 resistance mark with a 3.5% increase over the next four days. As of Monday, the rebound is still under progress; Bitcoin is trading above $63,000.
If the $62,125 level is supported, Bitcoin might experience more upward momentum and even retest its main psychological obstacle at $66,000.
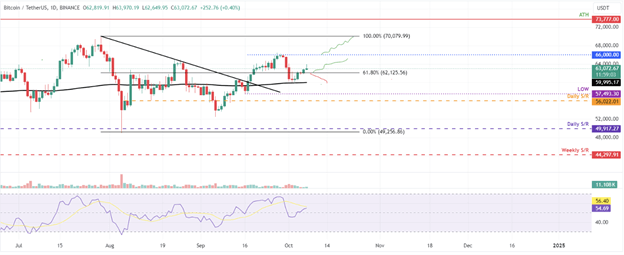
Reflecting trader uncertainty, the Relative Strength Index (RSI) on the daily chart stands at 53, somewhat above the neutral 50 level. The RSI must soar much above its neutral threshold if Bitcoin is to keep its strength.
On the downside, if Bitcoin falls short of $62,125, it might review the 200-day EMA at $60,000 in search of possible support.
Ethereum’s Overall Outlook
Monday’s 0.1% advance in Ethereum (ETH) followed the development of a Doji candle, indicating a possible reversal of the price trend.
This possible change follows the publication of Ethereum Improvement Proposal (EIP) 7781. The plan aims to cut slot time and raise the network’s speed by about 50%.
Illyriad Games co-founder Ben Adams’s EIP-7781 seeks to improve Ethereum’s throughput by 33% by cutting the slot duration from 12 to 8 seconds. Slot times are the periods whereby validators suggest fresh blocks to the Ethereum network.
This decrease in slot time also points to a drop in roll-on latency, especially for based roll-ons. Unlike optimistic and ZK rollups, these sequence transactions use the main chain.
The plan also calls for possible adjustments, such as boosting the gas limit from 30 million to 40 million or adding more blobs—data structures for storing Layer 2 transactions—from 6 to 8.
Notable crypto community members, including Ethereum researcher Justin Drake, have backed EIP-7781. He thinks the plan will boost distributed exchanges like Uniswap v3 by 1.22x and raise network speed by 50%. By lowering the price differences arbitrageurs profit from, this increase in efficiency could result in savings of $100 million, improving consumer results.
Ben Adams has addressed worries about possible hardware needs resulting from EIP-7781 by saying that the idea could provide advantages without raising peak bandwidth. EIP-7781 has to go through Ethereum’s governance voting procedure before developers start its deployment.
Relatedly, Coin Shares’ data shows that Ethereum ETFs had a net outflow of $29 million worldwide last week.
Ethereum Price Analysis
Currently trading at $2,450 on Monday with a minor increase, Ethereum is consolidating below the $2,500 threshold. With $41.23 million in long liquidations and $15.75 million in short liquidations, the top altcoin saw liquidations over the past 24 hours totaling almost $57 million.
Following rejection at the $2,500 psychological threshold, ETH moves inside a key rectangle channel, creating a Doji candle on the 4-hour chart. When an asset’s beginning and closing values are almost identical, a Doji candle results from traders’ uncertainty and may signal a trend reversal. This could cause a short drop, with Ethereum testing the support level close to $2,395.
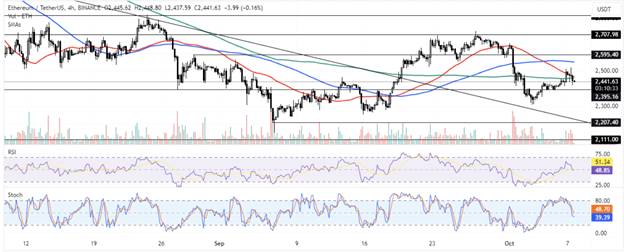
Ethereum’s price decline below the convergence of the 50-day and 100-day Simple Moving Averages (SMA), about $2,470, also supports the pessimistic view.
Furthermore, momentum indicators, including the Relative Strength Index (RSI) and Stochastic Oscillator (Stoch), are slightly below neutral, suggesting a pessimistic attitude among traders. The consolidation pattern could be called off if Ethereum goes below $2,395 on the daily chart.
Ripple Showing Downward Pressure
Ripple’s (XRP) price remains steady at around $0.530 and has been trading in a narrow band for four days as of Tuesday. Recently, the coin fell below its rising trendline. On Monday, it failed to break through a critical resistance level.
With an evident rise in the Network Realized Profit/Loss (NPL) metric and a decrease in daily trading volume, on-chain data supports a bearish view. This suggests that the price may go down.
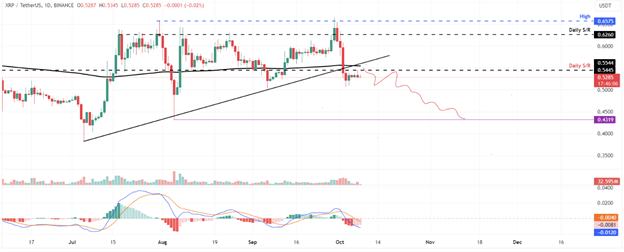
After being rejected from its July 31 high, XRP’s price broke through its rising trendline, which had been in place since early July. This move on October 2 shows that the market’s structure has changed from bullish to bearish.
Another vital support level was broken: the 200-day Exponential Moving Average (EMA) at $0.554 and a daily support level at $0.544. Even though it tried to get back up, XRP was rejected at the $0.544 level on Monday, and it is still trading below that level at around $0.528.
If the 200-day EMA at $0.554, which aligns with the rising trendline, turns into a resistance level, XRP could drop 18% and test the low point from August 5 at $0.431.
More evidence for this downward trend comes from technical signs. Moving Average Convergence Divergence (MACD) on the daily chart showed a negative crossover on October 2, a sign to sell. Red histograms below the neutral line show that the bears still control the trend.
On-Chain Data Shows More pressure to sell
The Network Realized Profit/Loss (NPL) measure also shows that XRP is decreasing. This indicator checks the return on investment using the number of on-chain trades to gauge the market’s mood.
Between September 30 and October 1, XRP’s NPL went from 13.24 million to 146.09 million, which means that holders have been selling their assets for a profit, strengthening the selling pressure. Historically, these kinds of price jumps mean that there is a higher chance that prices will drop even more as profit-taking gets stronger.
XRP’s daily trade volume has dropped significantly, which aligns with the downward trend and adds to the bearish signals. Ripple’s trading volume dropped from $3.13 billion on October 2 to $704.78 million on Sunday, the lowest amount since the beginning of September.
This sharp drop in volume shows that traders are losing interest in the Ripple blockchain and that it has less liquidity. This makes it more likely that the price will continue to fall shortly.


