
Bitcoin has closed above the daily resistance level of $64,900. Since then, ETH and XRP have crossed their key resistances, confirming a bullish trend.
Market Analysis Suggests Bitcoin’s Upward Trend
Last Sunday, Bitcoin broke above the downward trendline. On Tuesday, it had a 2-day, 7% rally and closed above the daily resistance of $64,913. BTC traded marginally higher on Wednesday, up 1.1% at $65,622. Upward solid momentum is often followed by a retracement, which provides a buying chance for sidelined investors.
Investors could consider taking positions from $59,200 to $57,800, where the trendline resistance that was broken now supports price action. However, the weekly resistance will be tested if BTC continues to rise.
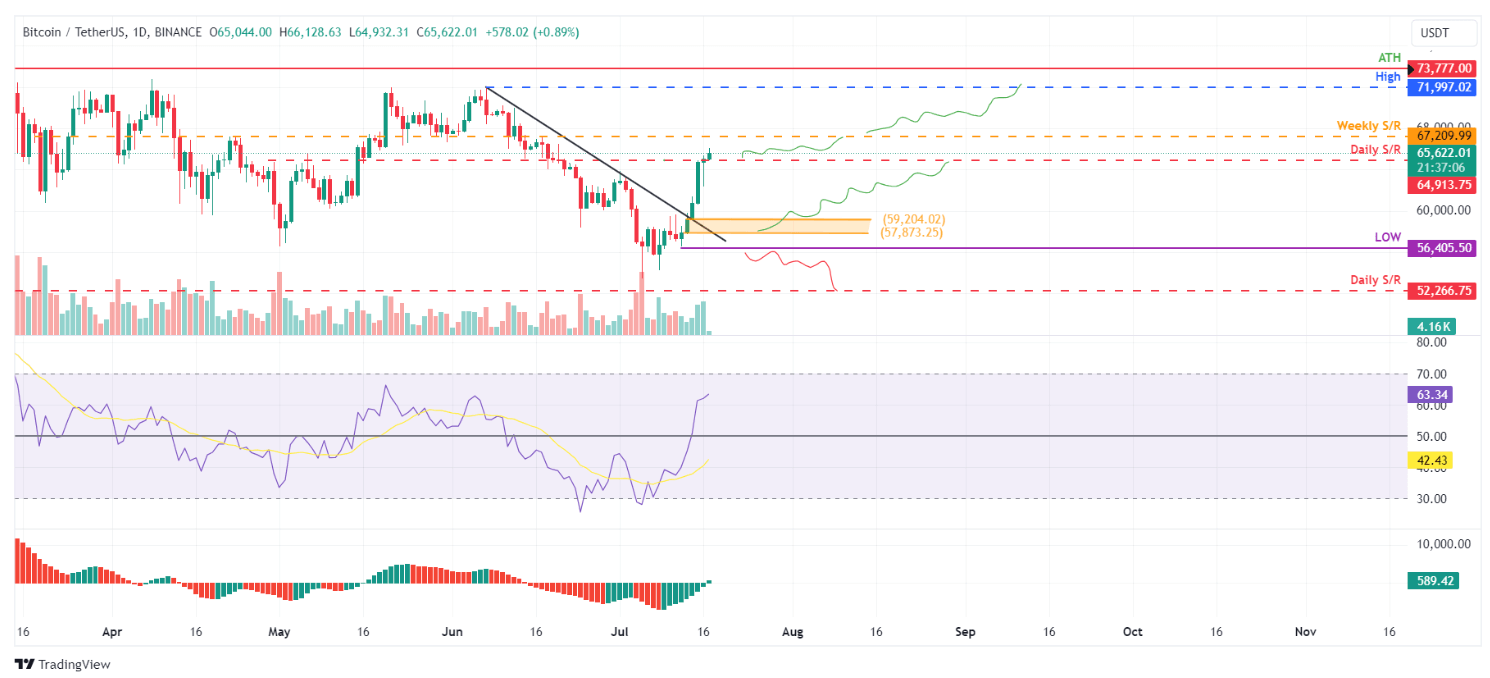
That resistance is at $67,209, 2.5% above its current price of $64,890. The RSI is above the neutral level of 50, while on the daily chart, eventually crossing above its neutral level of zero, the AO did. These momentum indicators do suggest bullish dominance.
It could also open up the possibility for an additional 7% increase, retesting its daily high of $71,997 from June 7 if above $67,209.
If BTC closes below $56,405 and makes a lower low on the daily timeframe, this would suggest a further continuation of bearish sentiment. Such a development could see the price of Bitcoin shed 7.5% and drop to retest its daily support at $52,266.
The “Trump Factor” Impact on Bitcoin
Bernstein analysts recently noted that the “Trump factor” is now lifting Bitcoin. This observation follows Donald Trump’s Ohio Sen. JD Vance’s selection as his running mate as Vance is known for supporting cryptocurrencies.
Despite Trump’s past criticisms of Bitcoin, this move has fueled optimism among Bitcoin investors. They hope for a Trump presidency. He has branded himself as a “crypto president.”
Gautam Chhugani and Bernstein analysts believe the cryptocurrency market sees a Trump victory as good for crypto. They claim that Bitcoin’s price will increase with Trump’s chances of winning.
Bitcoin Price Prediction

According to the most recent research, Bitcoin is at a pivotal point with a possible positive breakthrough. Indicators and past prices point to a bearish engulfing candle in the present range. It indicates a potential down correction.
The introduction of spot Ethereum ETFs in the US is inspiring. Also, lowered sales pressure followed the German government’s Bitcoin sales. As a result, Crypto Rover expects a bullish surge above $100,000.
A cryptocurrency analyst, Van de Poppe, expressed optimism regarding the future of the most important digital asset, projecting its price to be $100,000. He does not, however, outline a specific chronology for this assumption.
He said, “The largest amount of net inflow for Bitcoin since the end of June! Despite the negative news, Bitcoin’s price is stable at $65,000 with consistent institutional inflow. It’s only a matter of time before we see Bitcoin at $100,000.”
Though its present gap behind gold, assigned to the recent Mt. Gox BTC sell-off, the analyst notes that Bitcoin (BTC) seems ready for a possible comeback in the later part of 2024.
Van de Poppe argues that BTC would have already peaked at an all-time level without the sell-off.
Likewise, Mikybull Crypto anticipates a possible surge to $90,000, suggesting a bullish megaphone pattern marked by higher and lower lows.
Still, some analysts remain sceptical. Yoddha notes that Bitcoin’s dominance has been consolidating, implying a probable drop should important resistance levels not be broken.
The hopeful projections depend on Bitcoin’s capacity to exceed these critical thresholds, opening the path for a notable rise towards the sought-after $100,000 figure.
Ethereum Price Indicates Rally in Prices
On Sunday, the price of Ethereum surged past $3,240, surging 7.36% in just two days. As of July 17, it moved up 1% to $3,486.
If $3,240 holds as support and Ethereum closes above $3,524, it could rise by 6%. This would take it toward a test of the June 9 daily high at $3,721.
On the daily chart, the RSI is already above the neutral 50 level, while the Awesome Oscillator approaches it. To set a bullish trend into motion, both momentum indicators must remain above their respective mean levels, boosting the recovery rally.
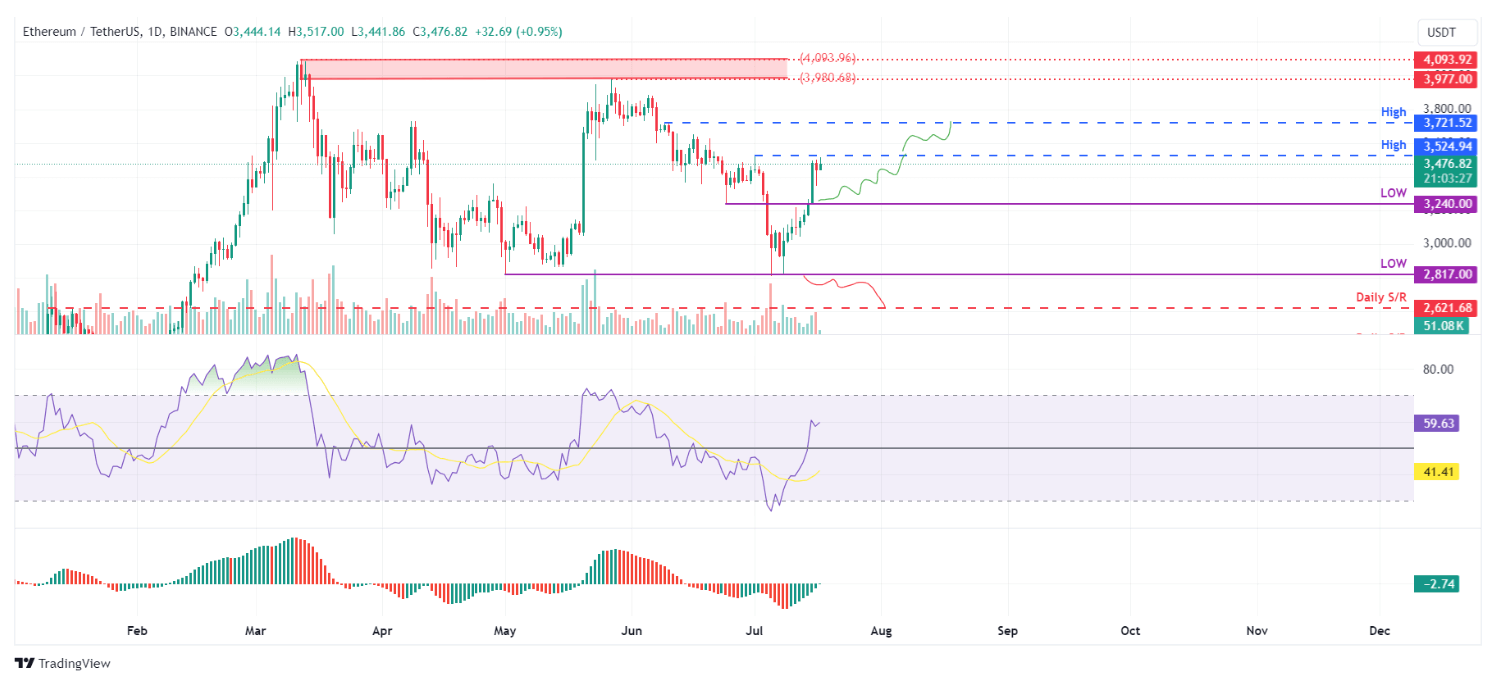
Conversely, if the Ethereum daily candle closed below $2,817 and made a lower low on the daily chart, that would imply that further bearish pressure had been maintained. Such an event could send prices another 7% lower and provide a return to the daily support level of $2,621.
Ethereum ETF Launch Preparations and Potential Market Impact
According to Bloomberg’s senior ETF analyst, Eric Balchunas, issuers have received responses from regulators over the final approvals for Ethereum ETH Exchange-Traded Funds ETFs, asking for all necessary paperwork by Monday for a launch next day, on Tuesday, July 19.
On May 23, the SEC accelerated the approval of eight pending Ether ETF applications, mandating that issuers file their S-1 registration statements before continuing with the launch.
Reuters sources reported that it plans to launch next Tuesday if all the applicants file their final offering documents with regulators by the end of this week. Sources indicated that all eight applications would be simultaneously approved and launched.
The eight ETFs that are on the verge of being rolled out are Grayscale Ethereum Trust, Bitwise Ethereum ETF, Blackrock’s iShares Ethereum Trust, VanEck Ethereum Trust, 21shares Ethereum ETF, Invesco Galaxy Ethereum ETF, Fidelity Ethereum Fund, and Franklin Ethereum ETF.
According to a recent report from Citi, the introduction of spot Ether ETFs could produce net inflows of 30%- 35% of the inflows seen at the launch of Bitcoin ETFs, where the distribution was skewed to the downside.
It estimates that net inflows will lie between $4.7 billion and $5.4 billion with a six-month horizon. Still, housekeeping warns that actual inflows into Ether and its beta relative to these inflows may be less than expected.
Analyst Eye On Ethereum
According to Bitwise, the expected launch of spot ETF Ethereum funds in the U.S. next week will drive the cryptocurrency’s price to record levels above $5,000.
In a Tuesday report, Matt Hougan, chief investment officer at Bitwise explained that a price surge may not be instant and early trading could be choppy as funds leave the $11 billion Grayscale Ethereum Trust, ETHE, in its shift to an ETF.
Nevertheless, Hougan expressed confidence that new all-time highs will be reached by the end of the year. “If market inflows exceed expectations, the price could rise even further,” he noted.
Is Ripple Also Indicating a Bullish Trend?
The price of Ripple is set to move upwards, judging by Tuesday’s performance, which saw it cross the daily resistance at $0.574.
On July 17, it rose 1% to trade at $0.585. If XRP continues to stay above the $0.574 level, it could see a 12% rally to retest its April 9 daily high at $0.643.
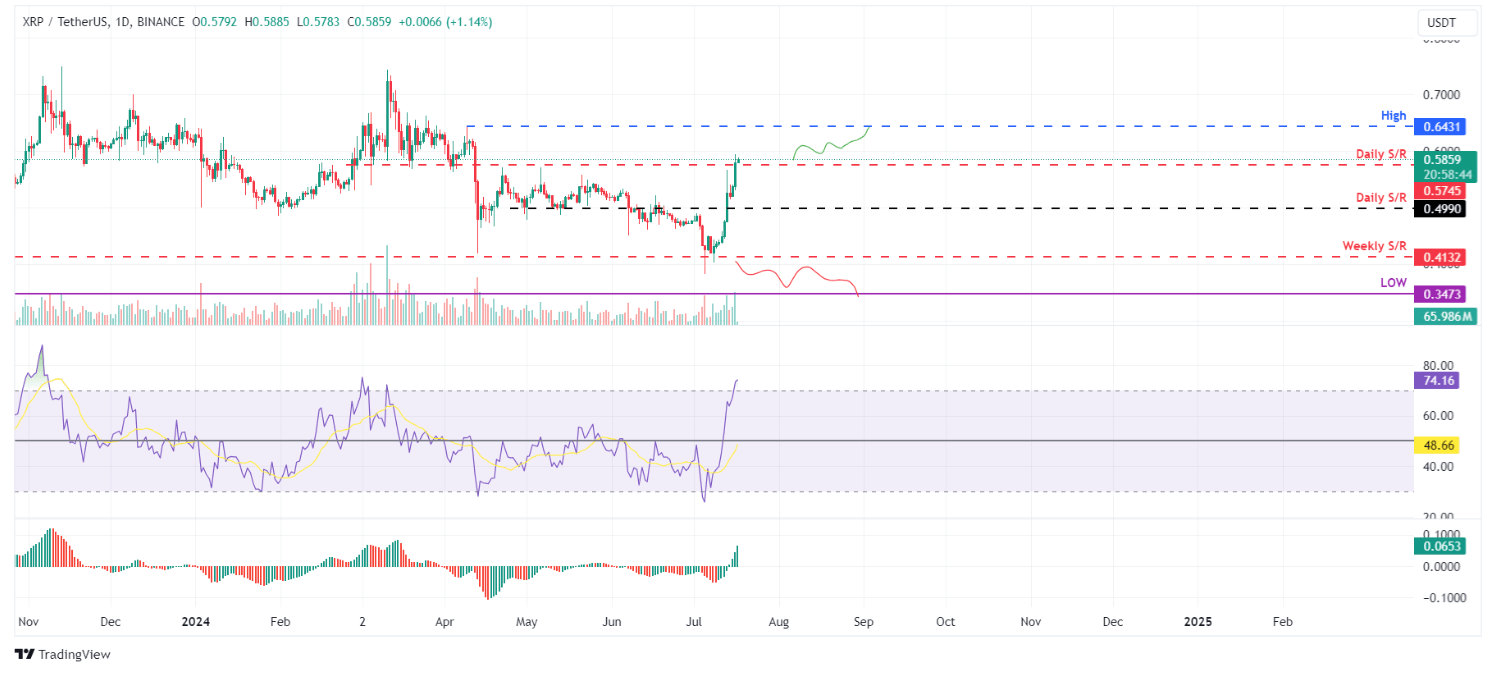
On the daily chart, the RSI and AO are above 50 and zero, their critical thresholds, showing strong bullish momentum. But, if the daily Ripple candlestick closes below $0.413, that would prove continued bearishness.
It would form a new lower low on the daily chart. This may cause Ripple-to-dollar prices to drop by as much as 16%. They would return to the original support at $0.347, set on March 12.


