
Bitcoin (BTC) traded around $58,000 on Monday, reflecting a 0.7% decline. The cryptocurrency continues consolidating within the $57,000 to $62,000 range observed over the past ten days. The bearish view is technically accurate since technical indicators remain weak, and BTC struggles to pass essential resistance levels.
Still, recent miner activity and investor behavior point to lower selling pressure, which supports the top cryptocurrency.
Bitcoin Bears Retreat
Lookonchain data indicates that Ceffu, a provider of institutional-grade custody solutions for cryptocurrencies and digital assets, paid Binance 3,548 BTC, valued at $211.6 million, starting on July 31.
Ceffu has deposited 3,568 $BTC($211.6M) to #Binance since July 31.#Ceffu provides custody and liquidity solutions for institutions, which means it is likely that institutions are selling $BTC. pic.twitter.com/Q9mLFMmC0z
— Lookonchain (@lookonchain) August 19, 2024
Given Ceffu’s expertise in custody and liquidity solutions for businesses, this suggests that institutional investors are selling Bitcoin. On Monday, Ceffu dropped another 121.10 BTC, valued at $7.10 million.
On Monday, however, Galaxy Digital, a worldwide cryptocurrency and blockchain investment company, withdrew 400 BTC valued at $23.4 million from Binance, according to Data Nerd. Galaxy Digital’s wallet currently contains 3,609 BTC, valued at $221.95 million.
1 hour ago, #Galaxy_Digital withdrew 400 $BTC (~$23.4M) from #Binance.
Just now, he still hodls 3,609 $BTC (~$221.95M).
Address:https://t.co/MD4R3KD7b3 pic.twitter.com/8HALxdC5E8
— The Data Nerd (@OnchainDataNerd) August 19, 2024
According to CryptoQuant data on Bitcoin’s Puell Multiple indicators, selling pressure from miners is reportedly declining. This data offers insights into Bitcoin’s cycles of mining profitability.
Puell calculates Bitcoin’s daily issuing value in USD against its 365-day moving average. A high Puell Multiple suggests that miners make more USD than the historical norm, increasing sales to pay for costs or guarantee gains.
On the other hand, a low Puell Multiple suggests below-average mining earnings, which would point to declining profitability or selling pressure. With a Puell Multiple of 0.7, Bitcoin suggests a lowered selling pressure or profitability period.
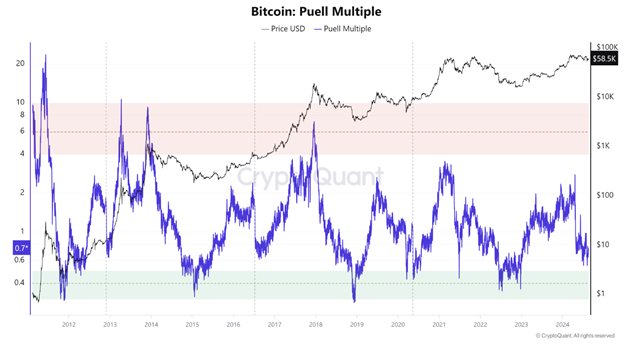
During the bull periods of 2016 and 2020, when Bitcoin values skyrocketed, the Puell Multiple likewise exhibited notable declines. Similar patterns in 2024 point to the possible conclusion of the phase of continuous price adjustment. Although it is difficult to forecast the precise ending of this phase, by the end of the third quarter of 2024, a possible beginning of a bullish surge could happen.
Bitcoin’s Long-Term Investors Push Realized Capitalization Over $3 Billion
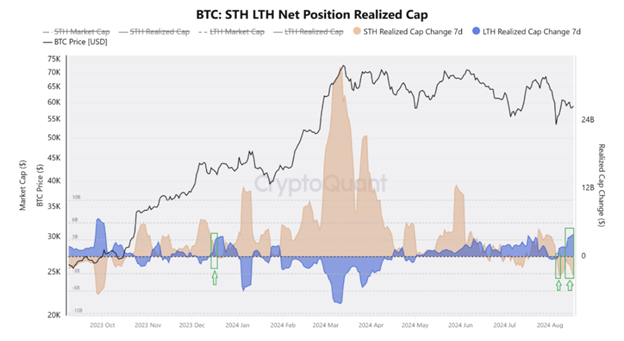
According to data from CryptoQuant, the realized capitalization of long-term investors’ Bitcoin has exceeded $3 billion, indicating a favorable long-term price trajectory.
The accompanying figure shows the net position realized capitalization for long-term (LTH) and short-term (STH) Bitcoin holders over time. Short-term holders usually buy and sell Bitcoin within a year and want to profit from price swings using day trading, swing trading, or scalping.
Often seasoned traders or institutional investors, long-term holders of Bitcoin, keep their assets for more than a year, following a buy-and-hold approach based on faith in Bitcoin’s future.
Along with more selling activity among STHs (highlighted by green boxes), the LTH realized capitalization beyond the $3 billion barrier, which suggests a recent change suggesting long-term holders accumulate Bitcoin. Short-term holders, in comparison, sell at lower rates.
Bitcoin Price Analysis
Based on the high from July 29 and the low from August 5, Bitcoin’s price stabilizes between $57,115 and $62,066, matching the 38.2% and 61.8% Fibonacci retracing levels. Monday’s Bitcoin price is trading somewhat higher, up 0.7% at $58,000.
If Bitcoin’s price approaches the 61.8% Fibonacci retracing level at $62,066, it could face opposition. This level corresponds with a previously broken trendline and the 100-day Exponential Moving Average, roughly $62,226, generating a notable resistance zone.
If Bitcoin fails to surpass $62,066, it might drop to $57,115 and fall further by 19% to test the daily support level of $49,917.
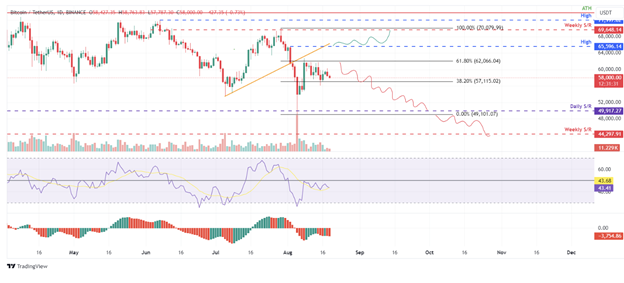
The Relative Strength Index (RSI) and Awesome Oscillator (AO) show weak momentum on the daily chart, being below their neutral levels of 50 and zero, respectively.
If Bitcoin’s price closes over $62,066, it might open the path for a climb towards the August 2 peak of $65,600, defining a new daily chart high. With the price testing the weekly resistance level at $69,648, such an action could result in an extra 6% rise.
Three Reasons Solana Might Achieve Double-Digit Gains
An essential rival of Ethereum, Solana (SOL), has seen a 150% rise in stablecoin availability. Expanding DeFi prospects, improved liquidity and lending systems, and project migration from the Ethereum ecosystem to Solana are primarily responsible for this development.
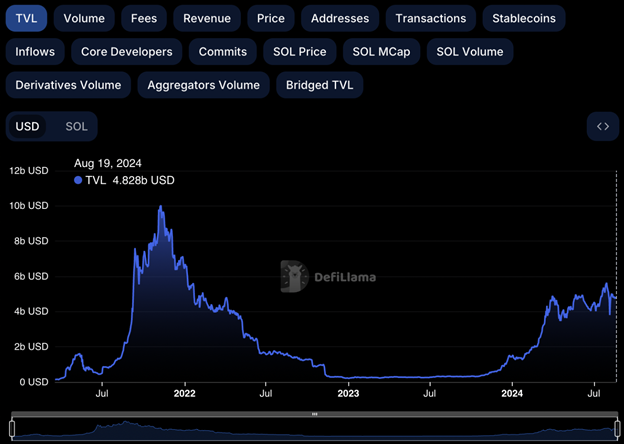
DeFiLlama statistics show that from the beginning of the year, the Solana blockchain’s total value of assets locked (TVL) has more than tripled above $4.82 billion. This increased activity in the Solana ecosystem positions SOL, the native token, ideally for a possible climb toward the $160 target.
Data from Dune Analytics and 21Shares shows that, as of August 12, Solana’s stablecoin supply is $3.76 billion. This number captures the DeFi prospects found within the SOL system.
Backed by fiat money, stablecoins are the primary means of access for crypto dealers to and from the market. A growing stablecoin supply on exchanges usually indicates a capital flow from traders using fiat money. The steady coin supply from Solana has increased 156% year over year.
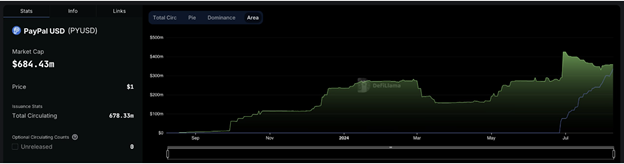
Projects include Sanctum, Jito, and Kamino, which have increased income possibilities in the Solana ecosystem utilizing funds invested in SOL. Within three months of its Solana launch, PayPal’s stablecoin PYUSD attained a market valuation of $300 million thanks partly to the Kamino system, which offers lending opportunities.
Nevertheless, the project has struggled with Ethereum scalability even though PYUSD has been offered on the Ethereum network for approximately ten months.
Sanctum is a blockchain network designed by Solana that provides developers with tools to create creative crypto-stakes apps. Its liquid token staking is garnering attention. Reordering or censoring Solana transactions will let Jito, an MEV (Maximum Extractable Value) bot, maximize their value, a method applied to capture further profit from blockchain transactions.
These projects have drawn people to the Solana ecology through their varied offers.
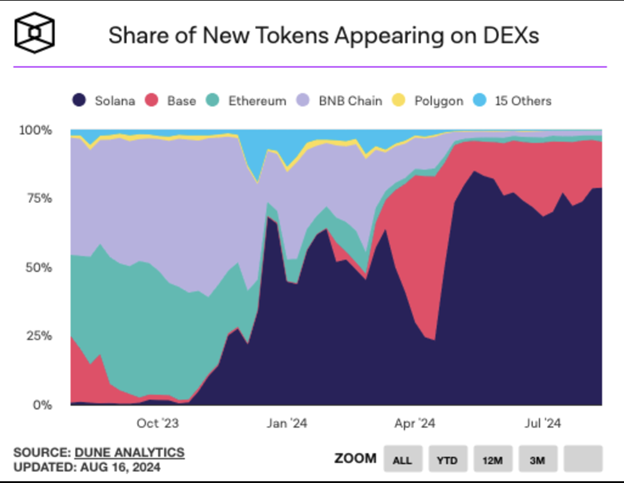
Prevalence of New Tokens on Decentralized Exchanges (DEXs)
According to Dune Analytics data, Solana leads in the new coins issued on distributed exchanges (DEXs). Base, Ethereum, BNB Chain, Polygon, and other blockchains included within the ecosystem follow it.
Meme currencies’ popularity and presence on DEXs like Raydium help justify Solana’s leadership in new token listings.
Solana has been rising for a multi-month period since October 2023. The trend has lately stabilized; the cryptocurrency has recovered above $140, following a low of $110 on August 5. On the daily chart, the Relative Strength Index (RSI) is currently 43.54, below the neutral level.
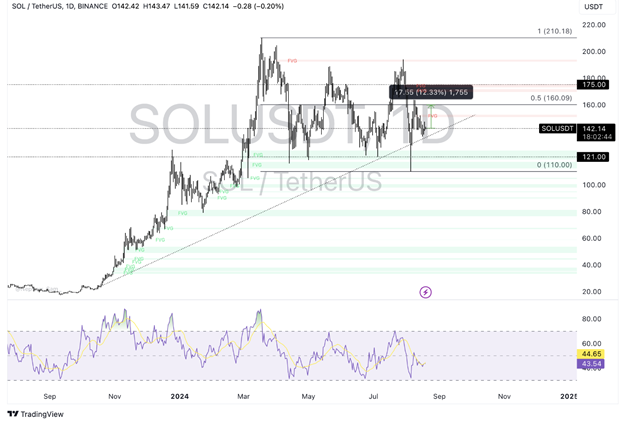
Increasing by 12.33%, Solana could hit $160.09, the 50% Fibonacci retracing level from the fall noted between its March 18 high of $210.18 and its August 5 low of $110. Anticipated resistance spans the Fair Value Gap (FVG) between $150.79 and $152.54.
On the downside, Solana has support around $121, which has steadily held for the past three months; next comes the August 5 low of $110.
Solana ETF Faces Challenges Due to Regulatory Uncertainty
It’s unclear what will happen with Solana’s market or the planned Solana ETF. The U.S. Securities and Exchange Commission (SEC) has not yet filed a notice about the Solana ETF.
This delay comes after failed attempts to release a Solana ETF while Bitcoin and Ethereum ETFs were released.
Forms 19b-4 for VanEck and 21Shares Solana ETFs appear to have been removed from the CBOE website.
Documents SR-CboeBZX-2024-066 & SR-CboeBZX-2024-067 aren’t accessible anymore via direct link, and are no longer visible in BZX Pending Rule Changes.
Another interesting thing is… pic.twitter.com/t81kVGJ3uH
— Summers (@SummersThings) August 16, 2024
Important documents were taken down from the Chicago Board Options Exchange (CBOE) website, which made things even more confusing and made it harder to predict what would happen with the ETF. Solana ETFs are still not a sure thing, and the fact that they haven’t gotten the legal approval they need could affect the price stability of the cryptocurrency.


