
After rebounding from a critical support level of $54,000 last Friday, Bitcoin (BTC) continued its positive momentum into the weekend and posted a modest recovery on Monday. The rally was supported by a slight surge in the Coinbase Premium Index, pointing to a mild uptick in investor activity over the weekend.
In contrast, on-chain metrics flashed bearish warnings, and despite those gains, caution remains in the outlook. Data indicated a drop in active addresses daily against a negatively weighted open interest funding rate, pointing toward network use and bearish market sentiment.
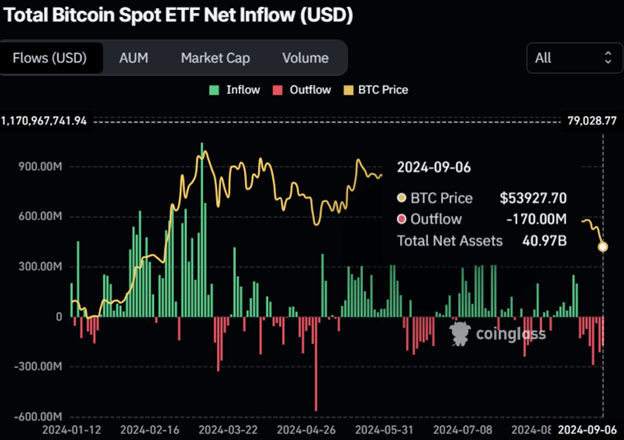
According to Coinglass data, U.S. spot Bitcoin ETFs saw a sharp outflow, with a net withdrawal of $706.1 million last week, which shows the dip in market confidence. Therefore, The total assets these 11 ETFs have dropped from $41.68 billion held in the prior week to $40.97 billion.
Further into this analysis, Santiment shows that those daily active addresses are actually down from 726,380 on September 6 to 597,560 this past Sunday, or a downward trend ever since mid-March. This speaks to a weakness in demand for Bitcoin’s blockchain and, in turn, may push the price down.
The OI-Weighted Funding Rate from Coinglass also looks negative, with a value of -0.0008%, suggesting that more traders are expecting the price to fall than to rise. That is usually commented on regarding market sentiment, which contemplates the yield of the futures contract weighted by its open interest. Negative values generally indicate bearish sentiment.

On the bright side, however, the Bitcoin Coinbase Premium Index, which informs on the price difference between the Coinbase Pro – USD pair and the Binance – USDT pair, slightly rose from -0.008 to 0.020.

With this uptick, trading above the 14-day Simple Moving Average of -0.009, it could indicate that whales-those large-scale investors are buying more, especially through Coinbase Pro favored by the institutions. This is a discreet but marked accumulation from the major market players against overarching uncertainties in the market.

Bitcoin Technical Analysis
Bitcoin significantly suffered a setback on September 2 since the token was knocked back from $59,560, the approximately 50% of the Fibonacci Retracement level based on a recent range from the late July high to an early August low.
After the rejection, Bitcoin’s price tumbled 8.7% in only four days. On Saturday, the cryptocurrency found support around $54,000, but on Monday, prices were still hanging above $55,316.
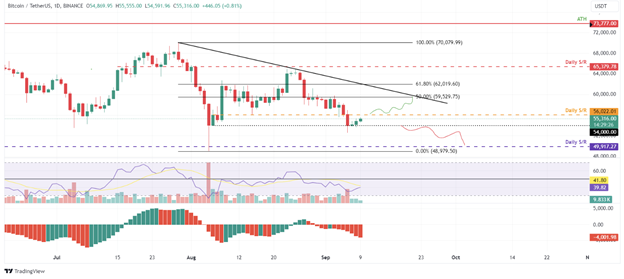
If Bitcoin closes below the $54,000 support, the decline could be as high as 7% to head back toward $49,917, which is the next important daily level of support.
Technical indicators on the daily chart, RSI and AO, point to weakening momentum. Both indicators are trading below their respective neutral marks, 50 level for RSI and zero for that, which glued the metrics to indicate a more probable downward continuation.
If Bitcoin can succeed in breaking above the $56,022 resistance, the bearish outlook will be invalidated. This could lead to an upward surge of about 6% by the crypto, probably reaching back to the $59,560 retracement level.
Record Outflows from Bitcoin and Ether Investment Products
Digital asset investment products had their largest net outflows since March last week, at $725.7 million, of which the share came from bitcoin-related products. Investors continued to retreat from Bitcoin spot U.S. exchange-traded funds, extending net outflows to a record eight-day streak.
According to CoinShares, a digital asset manager, Bitcoin products witnessed withdrawals of $643 million, while ether products lost about $98 million. The vast majority of the $721 million came from the U.S. market.
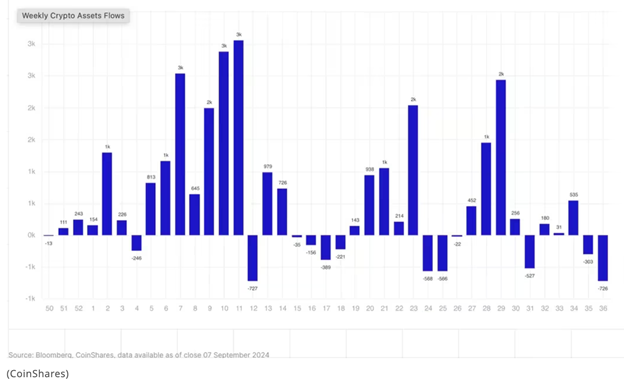
Bitcoin’s value fell 8% over the same period, finishing the week at $54,000 from over $59,000 on September 2. Along with a string of less-than-expected economic data releases from the United States, including the important nonfarm payrolls report, this fall matched. Despite these economic data possibly supporting a 50 basis-point rate reduction by the Federal Reserve, bitcoin’s market mood stayed mostly unaltered.
For the first time since their launch in January, Bloomberg data shows that spot bitcoin ETFs in the United States reported net outflows daily for eight straight days.
The publishing of the U.S. Consumer Price Index (CPI) on Wednesday and the Producer Price Index (PPI) on Thursday is much awaited by the financial community. A big political event is scheduled for Tuesday before these economic numbers. Before the forthcoming November presidential election, Donald Trump and Kamala Harris are scheduled to have their first debate.
Ethereum Drops Following Disappointing U.S. Job Data
Ethereum’s value declined almost 6% on Friday, impacted by the latest U.S. Nonfarm Payrolls (NFP) for August release, which has evoked concern in the United States markets. The United States economy added only 142,000jobs last month against the expected 160,000, pointing to a continuation of a July slowdown in hiring.
On its end, this has translated to marking the third day in losses in the crypto market, with Ethereum showing signs of recovery in today’s European trading session.
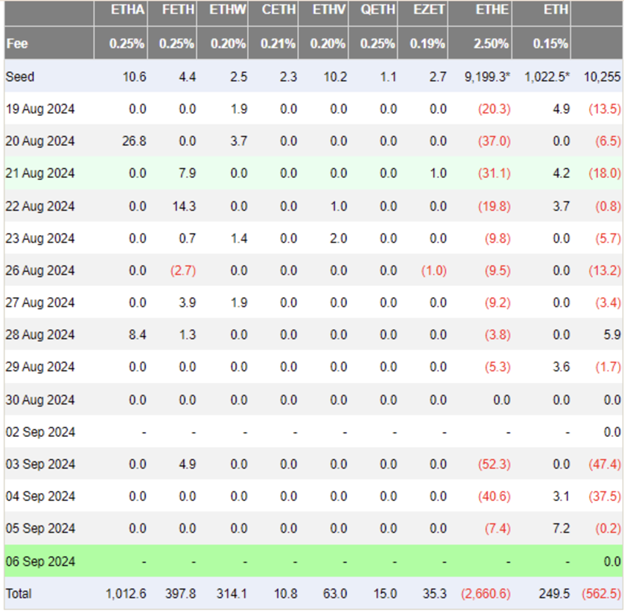
Net outflows of $0.2 million were seen in Ethereum ETFs, marking the lowest on record as the fund extended a streak of negative flows to a third day. Ethereum ETFs have seen $0.56 billion in net outflows since their inception, with just nine inflows compared to 23 days of outflows and one day with no flow.
Analysts at JP Morgan, while noting the underperformance, also point out that Ethereum ETFs fit quite well in performance behind the Bitcoin ETFs. Both products performed quite similarly on a one-month post-launch basis, using AUM as a percent of market capitalization.
https://twitter.com/matthew_sigel/status/1832027915547992357
In related news, asset management firm VanEck said it would close and liquidate its Ethereum futures ETF, EFUT, at the close of trading on September 16. The move comes just after VanEck launched a spot in the Ethereum ETF. This aligns with its earlier move to close a Bitcoin Futures ETF after the approval of a spot Bitcoin ETF, reported WuBlockchain.
Ethereum Technical Analysis
Ethereum’s trading price dropped; it closed Friday at about $2,220, a 6% drop for the day. Within the past 24 hours, Ethereum experienced a notable liquidation of $35.08 million, with $8.42 million from short holdings and $26.67 million from long positions.
Technical study of the daily chart shows that Ethereum has broken a declining trendline inside a symmetric triangular pattern, indicating a possible drop toward the $2,100 mark in the next weeks. Following significant rallies, this pattern matches trends from August to November 2022 and July to October 2023.
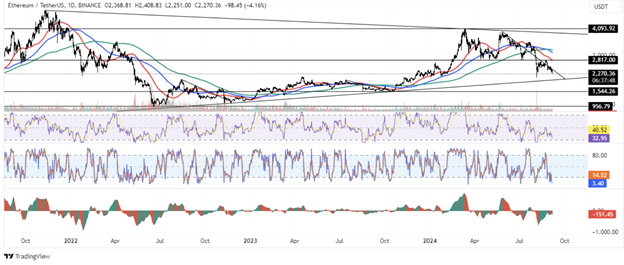
Mirroring its historical pattern, analysts predict Ethereum might find support around $2,100 before exploding to attack the $2,817 resistance mark. A successful breach of this resistance would open Ethereum’s path to approaching or even surpassing its yearly peak of almost $4,093.
However, a daily closure below the symmetric triangle’s lower ascending trendline might reduce Ethereum’s price toward the $1,540 support level.
From an indicator standpoint, the Relative Strength Index (RSI) is 33 and moves down, approaching an oversold area. The Stochastic Oscillator’s %K and %D lines show analogous possible oversold conditions. Furthermore, showing consecutive red bars below the zero line, the Awesome Oscillator points to a general bearish momentum in the market.


