
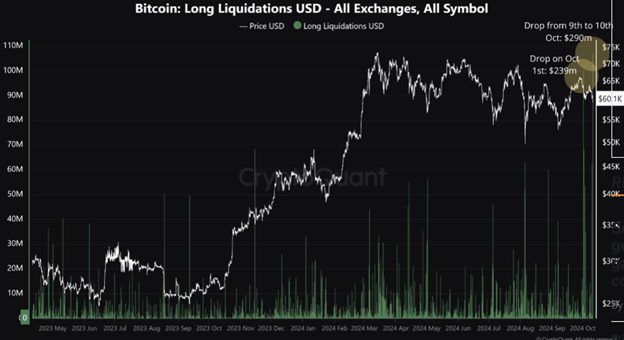
Bitcoin rose above $63,000 on Friday after Mt. Gox pushed forward its payment schedules to 2025, offering some comfort to distressed clients. Data from CryptoQuant showed that Bitcoin long liquidations hit $290 million on Thursday, a level not seen since 2022.
The cryptocurrency came under some pressure early in the Friday trading session, possibly due to uncertainty about whether another cut in interest rates could be expected.

The shrinking scope for timely expectations and high volatility became more explicit when the Bitcoin price fell below $60,000. But at some point, a price increase began for unknown reasons, perhaps due to Mt. Gox’s announcement of the postponement of its repayments.
From October 1st to October 11th, the Bitcoin price was down by 11%, resulting in massive long positions being closed. According to CryptoQuant, long liquidations occurred at $290 million between Wednesday and Thursday, the biggest since June 2022.
Since the halving event in April this year, Bitcoin has been ranging for nearly 200 days. According to Ki Young Ju, the CEO of CryptoQuant, if Bitcoin does not trigger a bull market within the next fourteen days, it will become the longest post-halving range-bound trading in the Bitcoin market.
Likewise, veteran trader Peter Brandt said that Bitcoin has been below its all-time high of $72,000 for the past 30 weeks. Brandt warned that the most popular crypto could plummet as it often drops over 75% when it fails to set a new high within this period.
The critical Bitcoin STH indicators are still around $62k and have been consistent for about three months.
CryptoQuant data indicates the volume of the STH realized share. It is seen that owing to Bitcoin’s prolonged sideways movement, the STH realized share has decreased during this period. From 55% three months, despite some 40% suggesting that short-term holders could be more sensitive to the next price, a share has been lowered.
Despite this shift, CryptoQuant analysts maintain that the bull cycle is still underway. They point to similarities with the 2013 and 2020 market cycles, during which long-term investors took profits twice as Bitcoin surged to new highs.
Bitcoin Faces Resistance, Declines Over 6% in Weekly Trading
This week, a resistance check with a descending trendline found Bitcoin, the largest cryptocurrency by market capitalization, declining more than 6% as of Thursday.
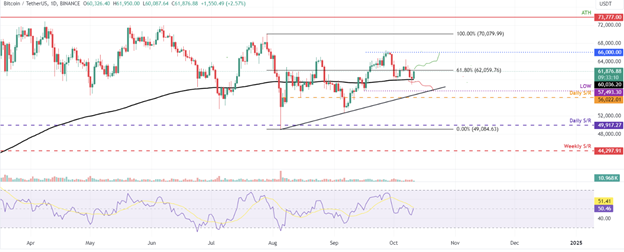
In terms of a descending trendline, which has been forming since March 28, the close connection to a significant resistance level at around $65,800 is aligned. BTC has reached a pivotal resistance line. As long as the downward momentum persists, Bitcoin may be further dropped to test its next main support level of $55,400, which is comparable to the 50-week EMA at $55,615.
The Relative Strength Index (RSI), a significant momentum moving average, remains in its neutral zone of 50, hinting at indecision among traders. If the RSI drops below this neutral level, another decline is possible.
Bitcoin seems to stabilize after the sell-off on the daily chart. On Thursday, BTC was back above its 200-day EMA at $60,036, while on Friday, it was trading above $61,800.
But if Bitcoin hits the $60,036 level, it might slide further down by over 4 percent, heading to retest the low of $57,493 dated September 16. This low corresponds approximately to an ascending trendline going back to multiple lows starting August 5.
On the daily chart, the RSI below its neutral level of 50 indicates weak momentum, which could support a bearish outlook and lead Bitcoin’s price down further. Instead, should BTC close above $62,059, the bearish scenario would be invalidated, and the ‘psychologically important’ $66,000 level could be retested.
Solana (SOL) Continues Upward Momentum, Surges Past $150
This week, Solana (SOL) continued its upward trend, rising Monday above the $150 level. As of press time, the Ethereum-alternative intelligent contract platform has seen a 3% increase daily and keeps gathering strong momentum.
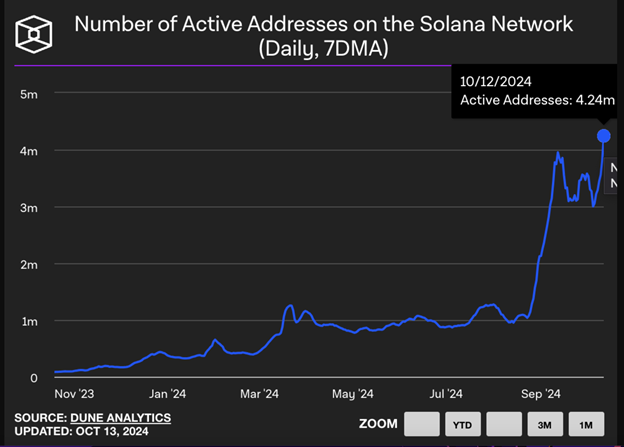
Strong on-chain statistics and an increasing Solana blockchain meme coin holder count point to crucial market drivers, suggesting more significant price potential.
Token holders of several Solana-based meme coins—including Daddy Tate (DADDY), Mother Iggy (MOTHER), Billy (BILLY), Ponke (PONKE), Retardio (RETARDIO), Michi (MICHI), and Sad Hamster (HAMMY) have increased during the past 30 days, therefore supporting Solana’s optimistic view.
Solana Price Outlook
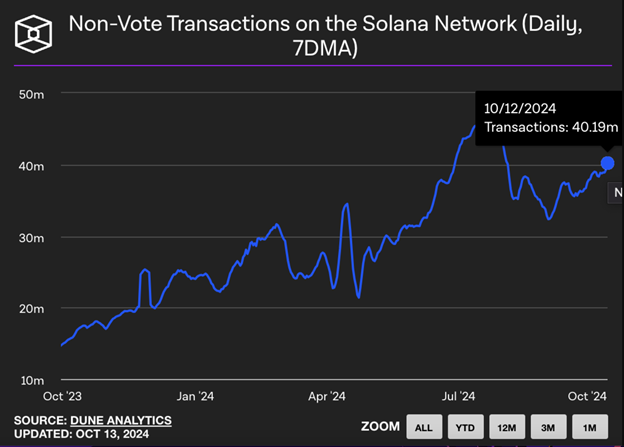
On-chain data for Solana also strengthens the bullish outlook over the past 30 days. However, The Block data shows that the number of transactions and active addresses on the SOL network grew by nearly 7% in the same period. The metrics indicate a higher demand and increased interest in the Solana ecosystem by market participants.
While Solana (SOL) has been quite volatile in 2024, the cryptocurrency is finding its feet as we close out 2024.
Solana was in the news last week due to its bullish momentum, which was generated in part by the technical improvements made by the Firedancer validator improvements for scalability and network resilience. Yet analysts continue to argue whether Solana will hit $250 soon.
The future of Luna is uncertain, but it is up 3.88% today, and its market cap is making a slight recovery, back to around $71 billion. Speaking of optimistic forecasts, Solana can rise to $186 as it breaches crucial resistance levels. A breakthrough here could pave the way to a run at $200, a psychological price point investors like.
In October 2023, Solana kicked off an upward trend that peaked in March 2024 at $210.18. Over the past six months, SOL has traded within a range. Lows of $134.27 and $144.71 on September 19 and October 12 mark key support levels, which are also married to imbalance zones on the daily price chart.
Two momentum indicators, Moving average convergence divergence (MACD) and Relative Strength Index (RSI), would further support a bullish case. The RSI hovered at 58.11 on Monday and has risen above neutral 50 but is nowhere near oversold conditions, while the MACD is in positive territory with green histogram bars above the neutral line.
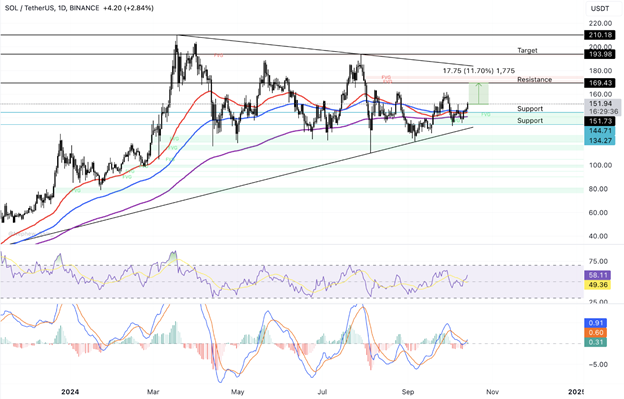
Moving ahead, SOL could rally 11.70% from its present trading price of $151.73 to hit resistance levels at $169.43, which is a pivotal value mark bounding the Fair Value Gap (FVG) between $169.43 and $171.61 from below.
However, the bullish outlook would be negated if a daily close fell below $144.71, potentially steering SOL lower toward $134.27.
Ripple (XRP) Holds Above $0.5300 as Firm Files Cross-Appeal in SEC Lawsuit.
XRP, Ripple’s native cryptocurrency, has stayed steady above the crucial $0.5300 support level and acquired impetus as the business revealed a cross-appeal in its continuous legal struggle with the U.S. Securities and Exchange Commission (SEC.). Focusing on payment remittance solutions, Ripple is also getting ready to introduce fresh custody tools meant for institutional investors.
Reacting to the SEC’s challenge of the court’s ultimate verdict in the four-year-long lawsuit, Ripple indicated on Thursday that it intends to submit a cross-appeal.
The SEC challenged the ruling, punishing Ripple with $125 million over institutional XRP sales. Stuart Alderoty, the Chief Legal Officer of Ripple, informed the locals that the legal certainty about XRP would not change with the appeal of the SEC.
For XRP holders, the cross-appeal news has improved their attitude. Social mood is still positive, while the Fear & Greed Index from CFGI.io comes out as neutral. Bitnomial, a derivatives exchange, has also sued the SEC, alleging “regulatory overreach” and a lack of clarification over XRP.
XRP Eyes Potential Rally Toward $0.5618
Since July, XRP has been in a bullish trend. It could increase again towards the 10-day Exponential Moving Average (EMA) at $0.5618, which is about 5% higher than it is already.
XRP, however, is coming up against the Fair Value Gap (FVG) between $0.5778 and $0.5445. The Moving Average Convergence Divergence (MACD) indicator gives out shrinking red histogram bars, which indicates the signals for a downtrend in XRP price momentum are winding down.
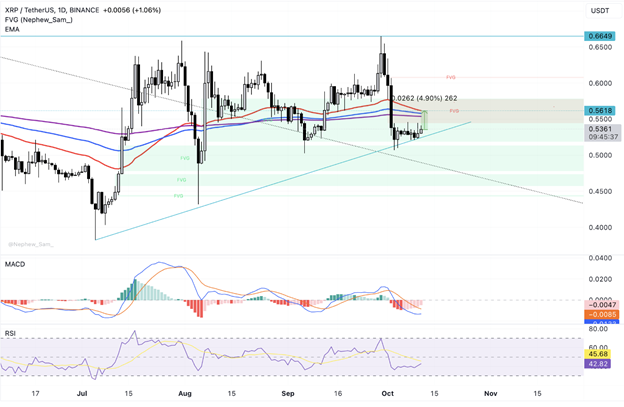
The Relative Strength Index (RSI) is now 42.82, which means that momentum is below the neutral level. Therefore, a complete stop in the pitching of the upward pattern may be the next development.
Also, in case of a correction, we could see a liquidity sweep down to the October 10 low of $0.5228.

