
Ethereum’s (ETH) 2% increase on Monday broke the typically negative sentiment linked with its dismal September performance. Ethereum exchange-traded funds (ETFs) continued their downtrend concurrently, and net outflows defined another week.
The key focus in today’s market summary is on Ethereum’s weak September historical results and ongoing outflows from ETH ETFs.
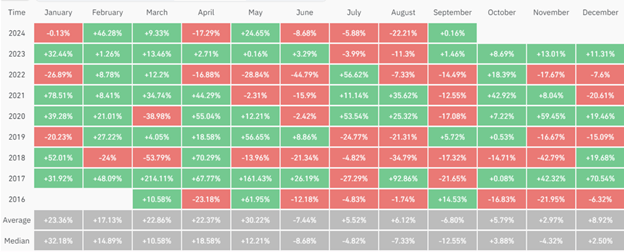
According to Coinglass data, Ethereum has only had a positive return in September once in 2019 since the ICO boom in 2017. Investor sentiment as the month starts is relatively negative, further shadowed by a 22% average loss recorded last August. The average return is -6.8%, and the median is -12.6%.
Despite these difficulties, some market analysts are cautious but optimistic that possible Federal Reserve rate cuts will start Ethereum’s comeback in the following weeks.
Regarding investments, Coin Shares notes that worldwide Ethereum ETFs saw net outflows of $5.7 million last week, which suggests a cautious attitude among investors under erratic market conditions.
The U.S. spot Ethereum ETFs, which experienced a notable $12.4 million net withdrawal, mostly drove outflows. This covers ETFs from big issuers such as Grayscale’s ETHE and BlackRock’s ETHA, which received no fresh inflows.
*13* of top 25 ETF launches this yr are either bitcoin or ether related…
Out of approx 400 new ETFs.
Top 4 ETFs all spot btc. pic.twitter.com/gIkAiIM1jZ
— Nate Geraci (@NateGeraci) September 2, 2024
While most people don’t like taking risks, three Ethereum ETFs—BlackRock’s ETHA, Fidelity’s FETH, and Bitwise’s ETHW—are among the top 25 launches this year. This shows that the market has a mixed sentiment.
Ethereum Technical Analysis
Monday saw Ethereum gain a little, trading at about $2,520 and increasing over 2%. With $27.59 million from long holdings and $10.9 million from short ones, the cryptocurrency saw notable liquidations of $38.49 million over the past 24 hours.
A technical study shows that on the four-hour chart, Ethereum is now stabilizing inside a crucial rectangle pattern marked by resistance around $2,817 and support at $2,400. Reflecting its 25-day tenure in this trading range, the digital asset significantly recovered from the support level on Sunday.
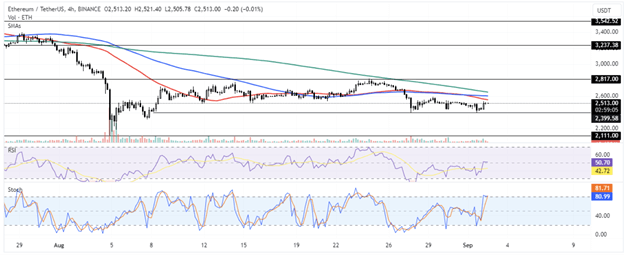
Market analysts predict that a break outside this rectangle will cause Ethereum’s price to show the next notable shift. If Ethereum surpasses the $2,817 resistance level, it will become a new support, guiding the currency toward the $3,252 mark. From April to July 2024, this resistance level provided solid support.
Investors should watch Simple Moving Averages (SMAs) for 200, 100, and 50 days as additional resistance. On the other hand, a drop below the $2,400 support might set off a bearish trend, dragging Ethereum down to the $2,111 support level.
Rising above the midline and following a cross above its moving average on the four-hour chart, the Relative Strength Index (RSI) displays indications of strength. The %K line of the Stochastic Oscillator has fallen into the oversold zone, indicating a possible downward correction is about to occur.
If Ethereum closes a daily candlestick below $2,111, it might mean the end of the present upward trend. A downward movement to roughly $2,416 could clear approximately $32.47 million in liquidation leverage shortly.
Bitcoin’s Short-Term Outlook in Light of Recent ETF Activity
Following an 11% decline last week, Bitcoin (BTC) slightly recovered on Monday, closing beneath the $57,500 level. This drop is blamed on the decrease in demand from US spot Bitcoin ETFs, which experienced notable outflows of $279.4 million last week.
Additionally, market indicators suggest a potentially shaky recovery for Bitcoin. According to Lookonchain, a significant transaction was recorded over the weekend when a whale transferred 4,164 BTC, valued at approximately $243.8 million, to the Binance exchange.
This happened at the same time that investor interest and activity on Coinbase generally went down. This showed that the rise in Bitcoin prices might last only briefly since September is usually a tough month for the cryptocurrency.
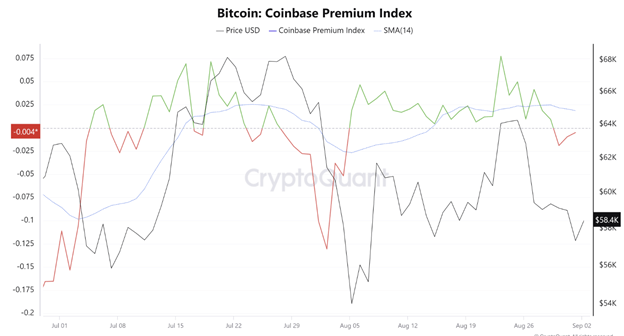
The CryptoQuant Bitcoin Coinbase Premium Index, which tracks the purchasing patterns of significant buyers, dropped a lot. The measure looks at the price difference between Coinbase Pro (USD pair) and Binance (USDT pair), showing how whales spend their money.
Between August 24 and September 1, the index fell from 0.077 to -0.004, which shows that people are now willing to sell at lower prices. It trades below its 14-day Simple Moving Average (SMA), 0.018. Institutional buyers aren’t as interested since they often use Coinbase Pro to enter the cryptocurrency market.
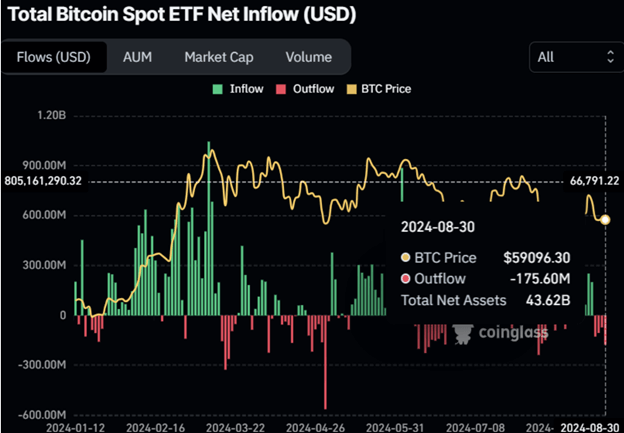
Coinglass data also shows that the total reserves of US spot Bitcoin ETFs have dropped to $43.62 billion, which is part of a more significant trend of negative market sentiment.
Data from Coinglass shows that the performance of Bitcoin has differed throughout several months. For the currency, September’s average negative return was -4.45% historically. By contrast, the fourth quarter has been more positive, with an average return of +88.84%).
The forthcoming November U.S. elections could affect the dynamics of the Bitcoin market, determining its price in favorable conditions. This emphasizes Bitcoin’s performance in the fourth quarter even more.
Bitcoin (BTC) Technical Analysis
Bitcoin’s price closed below the vital support level of $58,783 on Sunday, bottoming at $57 201 based on current trade activity. On Monday, though, it somewhat recovered, trading up by 2% at $58,435.
Comprising the 50% price retracing from a high in late July to a low in early August, market watchers observe the $59,560 resistance level intently. Should this resistance persist, Bitcoin may drop 4% from its present level, testing the $56,000 support level.
With readings below their respective midpoints, showing a lack of domination by either bulls or bears, indicators such as the Relative Strength Index (RSI) and the Awesome Oscillator (AO) reflect a neutral market trend.
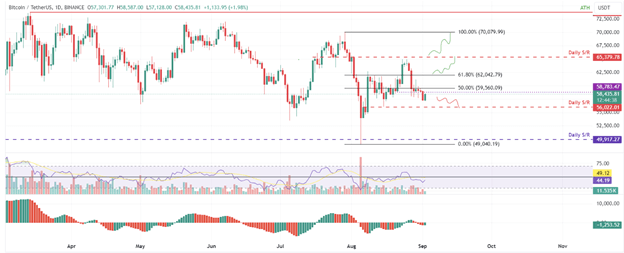
In a potential upside scenario, should Bitcoin break above the $59,560 resistance, it could aim for the 61.8% Fibonacci retracement level at $62,042. Surpassing this could invalidate the bearish outlook and lead to a further rise of 5.5%, possibly reaching the resistance level of $65,379.
Potential Gains for XRP as Ripple Army Considers DAO
The Ripple (XRP) Army, which comprises token holders and validator node operators, is currently arguing about the XRP Ledger and the possibility of creating a Decentralized Autonomous Organization (DAO). Adding a DAO could significantly improve the decentralization of governance, giving the group more power.
A popular person in the XRP community who goes by the Twitter handle @DarkhorseDNME4 recently said they thought the XRP Ledger should be even less centralized. A validator shared this view with the name @Vet_X0, who added to the conversation by sharing new information.
🤬🤬🤬 As an XRP holder I’m going to give my absolute truth to you @Ripple @bgarlinghouse @JoelKatz @MonicaLongSF @Vet_X0 for the last 2 years here in X I have highlighted, your bot use, your XRP-0, prisma, Your Net neutral ODL transactions, your reliance on Centralised…
— ĐΛRKHØRSΞ™ (@DarkhorseDNME4) September 1, 2024
The main points of contention are whether or not there needs to be a DAO on the XRP Ledger, whether projects built on the Ledger are responsible for giving token holders benefits, and whether or not XRP holders can directly benefit from the activities of the payment remittance firm and the Ledger itself.
A DAO is a considerable change in digital governance because it gives the community the power to make decisions. This could weaken the central payment remittance firm’s impact and lead to a less centralized future for the Ledger.
Even though the XRP Army stood by the company during its legal battles with the U.S. Securities and Exchange Commission (SEC) and celebrated big changes like the launch of an Automated Market Maker (AMM) on the XRP Ledger, @DarkhorseDNME4 recently tweeted that these successes haven’t had much of an effect on the token’s price.
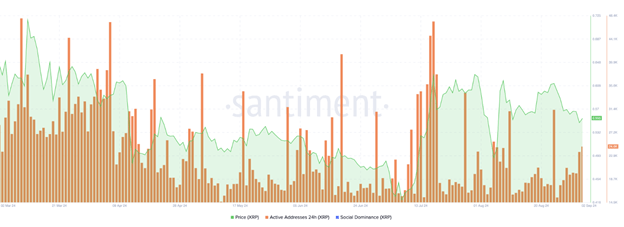
A recent analysis of on-chain data by cryptocurrency intelligence company Santiment shows that the Ripple network is seeing much more activity. There was a nearly 25% rise in live addresses from August 31 to September 2. The high activity level, especially in the first two days of September, shows that the crypto community is becoming more involved and that traders may become more interested.
XRP Price Analysis
Initially, the XRPLedger’s native cryptocurrency, XRP, has been trapped in a declining trend since peaking at $0.9380 on July 13, 2023. This downturn became more severe, and by July 5, the token dropped to $0.3823. XRP seems steady, trading slightly above the $0.55 line, and, based on most recent statistics, is expected to rise by 12% towards a notable resistance level of $0.6217.
XRP has faced opposition at $0.6217 several times from April through August. Furthermore, the $0.60 threshold is predicted to cause significant opposition in its ascent towards this level.
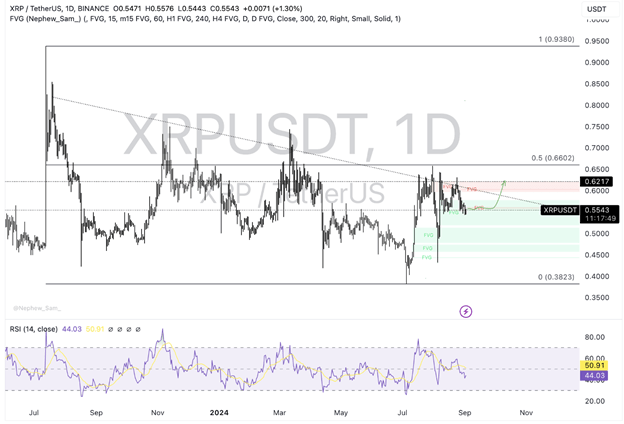
The market lacks upward momentum, with XRP’s Relative Strength Index (RSI) of 44.03 below the neutral 50 threshold.
If XRP falls below the current low of $0.5434, any optimistic projections may be negated. This decline may cause XRP to test the bottom boundaries of the Fair Value Gap (FVG), which runs between $0.5188 and $0.5785.


