
Trading cryptocurrencies within a brokerage or crypto exchange involves speculating on the prices of digital assets such as Bitcoin, Ethereum, and other coins for profit. Unlike any other traditional market, crypto trading is distributed and available at any time, which enables anyone in the world to execute a trade.
Since the digital currencies now gain much popularity, traders should employ more effective strategies. Traders have applied a number of indicators for inspecting the movements of the market, knowing trends, and guiding one on wise trading. Knowing how the market operates and developing robust trading strategies depend on such indicators.
Why Are Indicators Important to Crypto Trading
For the crypto traders, the indicators are important; they provide them with the realization of price fluctuations and market changes. These tools use mathematical calculations and statistical functions to empower a trader to apply patterns in the market, trends, and potential price corrections to make the right decisions at the right time on entry or exit to maximize his gains by reducing losses.
Feelings-based trading decisions can be hazardous, given the volatility and expediency related to cryptocurrency markets, which makes prediction tough. Indicators are a useful tool for traders adopting a dispassionate look toward market patterns and basing decisions on statistics.
Remember that the indicators tend to work most effectively when used in combination with one another in concert. Thus, traders who employ multiple indicators can often confirm their signals and know with a degree of certainty that their trading call is the proper one, since multiple signals allow one to gauge whether current trends are, in fact, correct.
1. Relative Strength Index (RSI)
The RSI is one of the widely used technical indicators by crypto traders. This indicator is used to judge the speed at which the price of a cryptocurrency is changing, by comparing between recent gains and recent losses. By RSI, you can discover whether a certain coin has been oversold or overbought.
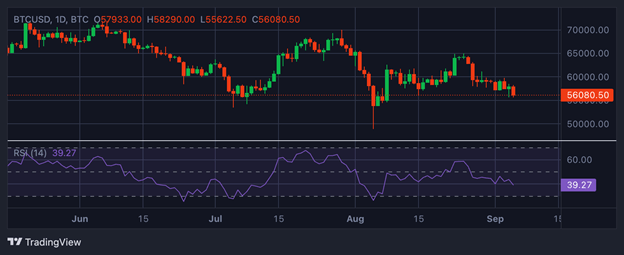
On the 0-100 scale of RSI, usually values above 70 reflect that an item has been overbought, while values below 30 tend to indicate that it has been oversold. This makes the RSI a valuable tool for traders inclined towards the feeling that the market does.
Advantages and disadvantages of RSI
Some of the main points for the RSI are that it is simple to use and that guidelines on how to use it are widely available. It provides very distinct indications of the state of the market, and traders really need to have the RSI tool. It points out overbought or oversold markets that dictate judgment.
Although the RSI has its own merits, inactive experience might put novice traders at a disadvantage when trying to understand and use this indicator. Traders should combine the RSI with other indicators and analysis tools to enhance their trading effect. In crypto markets, such an integrated approach will help provide informed trading results and a stronger trading strategy.
The Origin of RSI
The RSI was developed by J. Welles Wilder Jr. back in the 1970s and then introduced to the trading world in 1978. The RSI was developed by Wilder to help traders identify when a security has entered an overbought or oversold condition-a good indication of an imminent reversal in the market. Although it was intended for the analysis of commodity markets, soon afterward, the use of RSI began blossoming into many other financial markets.
RSI Formula
Showing the magnitude and velocity of a stock’s price, due to which it has moved, the RSI gives a reading from 0 to 100. To phrase this as a percentage, one would divide the average gain over a given period by the average loss over the same period, then multiply the result by 100. The formula is:
RSI = 100– [100 / (1 + (Average Gain/ Average Loss))]
The RSI is desirable in including a more general trading plan, which includes various indicators, chart patterns, and basic research. The RSI shall move to the supporting tool to guide behavior, not to the only motive on which trading decisions are based. RSI Divergence When the RSI is moving in the opposite direction of the price change, that’s called divergence; this could be termed as a positive divergence.
The market may make a turnaround when the price has reached a new low, but the RSI shows a higher low. Conversely, the negative divergence happens when the price makes a new high, and the RSI makes a lower high, which generally points out that a turnaround in direction could be close.
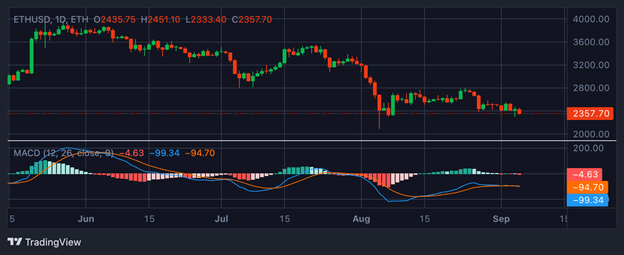
2. Moving Average Convergence Divergence (MACD)
Moving averages (MAs) are tools used in technical analysis to smooth out price data by finding the average price over a specific time frame. They are very helpful for finding trends and amounts of support and resistance. By showing how prices have changed over time, moving averages help traders see when it might be a good time to enter or leave a trade on the stock market.
To compare it to something you know, imagine moving averages as the window of a car. They make it easier to see the road ahead by reducing the effect of short-term changes on the view and drawing attention to the overall direction of movement.
Types of Moving Average Convergence Divergence (MACD)
Most moving averages are one of three types: the Simple Moving Average (SMA), the Exponential Moving Average (EMA), or WMA, and the Extended Moving Average (EMA). Each type can be told apart by how it calculates and how much weight it gives to the data points.
-The SMA is calculated by adding the closing values of securities over a designated period and dividing this total by the number of periods. It gives every data point across the period equal weight.
-Unlike the SMA, the EMA pays more attention to recent prices and is more sensitive to recent price swings.
-Additionally, the WMA gives more recent prices within the computation period top priority by changing weights among data points.
Each variety offers unique insights into market behavior, so these variations satisfy different trading methods and tastes.
History of MACD
The first application of moving averages in technical analysis occurred at the beginning of the 20th century. Traders wanted to smooth price fluctuations and establish the market’s main trends. Thanks to the efforts of influential figures such as Richard Donchian and Charles Dow, moving averages have undergone significant changes and improvements.
These were the first technical analysts who set the stage for what would become an integral part of Candlestick chart analysis. Charles Dow enjoyed using moving averages to define the market trend and pinpoint potential buying and selling opportunities.
The Pros and Cons of Moving Averages
Moving averages are a tool widely used in technical analysis. They possess various advantages and a few significant limitations.
Pros:
Ease of Use: In separating the market vibration, simple moving averages offer a clear visual indication of market trends; hence, they help simplify the research.
Trend Identification: These are handy tools for keeping up with the market’s trends, along with levels of resistance and support that give potential buy or sell opportunities.
Combination with other indicators: Moving averages can be combined with other technical analysis tools to fine-tune trading signals.
Cons:
Lagging in Nature: Moving averages lag because they can never keep up with rapid price changes. Therefore, late entries, lost trading opportunities, or delayed signals may result.
Susceptibility to False Signals: Moving averages give false signals during weak and sideways markets, which might result in potential losses.
No Success Guarantee: Decision-making is strictly based on moving averages, which do not guarantee success in trading.
3. Aroon Indicator
AROON is a technical analysis indicator crypto traders use to predict when and how far a trend change may occur. It is comprised of the Aroon Up line and the Aroon Down line. The Aroon Up line shows the time passed since a cryptocurrency’s highest price, while the Aroon Down line indicates the time elapsed since its lowest price.
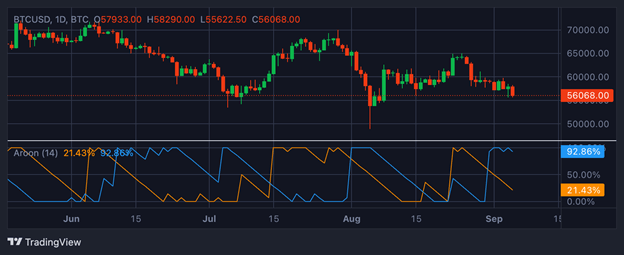
These lines are always between 0% and 100%. A powerful rally is observed when the Aroon Up value is above 50%, while the Aroon Down value is below 50%. Conversely, a downtrend sets in when Aroon Up values are less than 50% and Aroon Down values are greater than 50%.This idea is central to the Aroon indicator: during an uptrend, prices tend to reach new highs; in a decline, they tend to reach new lows.
Advantages of the Aroon Indicator
The Aroon indicator is easy to understand and use compared to other technical tools that may require more complicated math. It gives clear information about the trend’s direction and strength, so it’s easy to tell right away whether a cryptocurrency is going up or down strongly.
It helps to see when a trend changes, usually shown by the Aroon Up and Down lines crossing over each other. Also, if both lines stay below 50% for a long time, the cryptocurrency’s price has stabilized during the stabilization phase.
Disadvantages of the Aroon Indicator
It could be the Moving Average Convergence Divergence (MACD) or the Relative Strength Index (RSI) that moves prices ahead, but the Aroon indicator moves prices behind. This means it will only show how prices have moved in the past and may only confirm trends already happening.
Traders may not catch up with trading opportunities unless used with leading indicators. Whenever the markets are highly volatile, the Aroon indicator can give false indications of reversals due to cross-overs of lines above their critical levels without any actual trend reversal. This may further lead to misunderstanding and incorrect trading decisions.
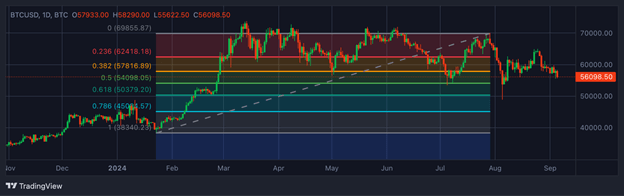
4. Fibonacci Retracement
The Fibonacci Retracement is among the most popular technical analysis tools in cryptocurrency trading, which helps to identify potential levels of support and resistance.
This can be done by using the Fibonacci sequence when every number is derived from a sum of two numbers preceding it. To enter Fibonacci retracement levels, the trader must divide the height difference between high and low cryptocurrency prices by specific Fibonacci ratios, usually 23.6%, 38.2%, 50%, 61.8%, and 100%
Advantages of Fibonacci Retracement
The best thing about Fibonacci Retracement is its depiction of potential market support and resistance levels. One can always modify time frames and sensitivity settings as an adaptive tool using one’s trading methodology.
However, Fibonacci levels may differ for different people since traders can use any time frame or ratio. This can lead to trading signs at variance with each other. On a chart, from a low point marked as “1” up to a high point marked as “0”, traders use the Fibonacci retracement tool to find possible levels where prices might fall back. Some such levels, like 0.382 or 38.2%, point to those support levels in which the product’s cost stabilizes.
Traders will often watch how the price interacts with other key levels, 0.618 and 0.786, to create a price channel that could last for days before breaking downward.
Disadvantages of Fibonacci Retracement
Because Fibonacci retracements have become so common, understanding how they work takes much time and effort. The tool depends on the Fibonacci sequence, which works with numbers rather than logical proof. This might be a problem for traders who want facts to base their strategy on.
Also, not everyone has the same opinion on how Fibonacci retracement works, which is also debate-worthy. Those who are using the Fibonacci trade and succeed with it answer that it works, while the ones who do not like it say that it is unpredictable and works only because everyone believes in it, making it self-fulfilling.
A Fibonacci-based approach indicates market corrections, reversals, and countertrend bounces. However, it fails to confirm any other indications nor gives any substantial signs of a strong or weak market. That’s why traders should be very cautious and combine various types of analysis with Fibonacci tools to make better decisions.
5. On-Balance-Volume (OBV)
The OBV, therefore, is a technical analysis tool that measures the buying and selling pressure in the market. OBV works through changes in volume: in such a way that total volume deductions occur when the price falls, and additions into the total OBV occur when the price of an asset has risen. In their result, the OBV line swings around the central zero line and gives traders information about either the direction or strength of market moves.

Advantages and Disadvantages of OBV
The OBV indicator is used in cryptocurrency trading to confirm continuous trends and point out probable deviations between the price of a particular asset and the OBV. Such discrepancies are significant because they tend to show a possible change in the trend. For instance, if the OBV happens to be on its way down during the upsurge of an investment price, it will indicate declining momentum with a possible pullback. Along with other technical instruments, OBV can fine-tune trading signals and reduce the possibility of fake trades.
However, the performance of the OBV indicator might differ in different market states. Therefore, it works well in trending markets, where well-defined directional movement can be detected within buying or selling pressures. Because of less reliable signals, range-bound or chopped markets are the worst suited for OBV.
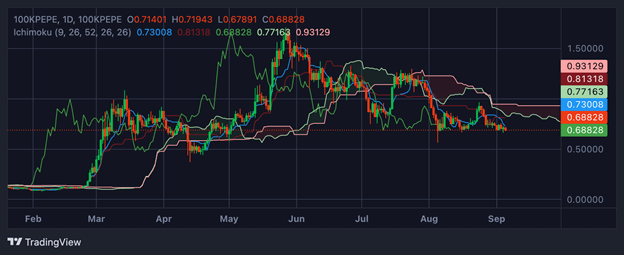
6. Ichimoku Cloud
The Ichimoku Cloud is a complex technical analysis used in crypto trading. It aims to identify potential reversal points and different resistance or support levels and measure momentum. The five key lines of the tool are the Tenkan-sen, Kijun-sen, Senkou Span A, Senkou Span B, and Chikou Span, which are placed on a chart together in a cloud-like shape.
The Tenkan-sen and Kijun-sen intersect at potential trend reversal points, while the Senkou Span A and B lines show the likely support and resistance levels. The Chikou Span line plots the relationship of price to these lines, which forms the basis of this indicator’s reading of the trend’s strength.
Ichimoku Cloud: Ins and Outs
The Ichimoku Cloud is a beneficial indicator when purchasing any cryptocurrency. Its biggest advantage is that it provides traders with a totally rounded perception of the market and necessary details concerning trends, levels of resistance and support, and momentum signals. This tool is so versatile that traders can adjust its settings to their trading styles and preferences.
They can work with time frames and sensitivity levels to adapt them to their trading strategies and risk tolerance.
Ichimoku Cloud can be overwhelming for those starting their journey in technical analysis. The design is intricate and precise, and understanding its constituents fully requires quite a lot of effort.
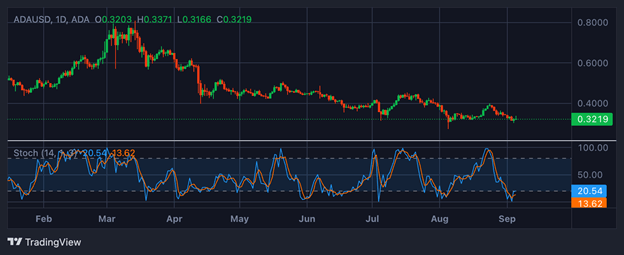
7. Stochastic Oscillator
The Stochastic Oscillator is one of the technical predictors widely used by cryptocurrency traders. It helps them notice possible trend changes and overbought or oversold situations. This momentum indicator works because ending prices tend to move toward the upper range when they increase. Conversely, they tend to peg them in the lower range when they go down.
The Stochastic Oscillator determines whether an object is high or low by comparing the current closing price with its range over a period, which is usually 14 days. With this information, traders can make intelligent choices about entering and leaving trades.
Pros and Cons of Stochastic Oscillator
The stochastic oscillator offers several benefits to traders. It provides an easy and efficient way to identify potential trend reversals and highly abnormal conditions in the market environment. Its flexibility allows traders to adjust the periods and sensitivity levels to best suit their trading approaches.
However, the downside of The Stochastic Oscillator is its tendency to spit out conflicting signals when prices remain within a relatively narrow range or when the market has stabilized. To avoid being misled during such a stage and taking the wrong position, traders should be cautious and look for other indicators or market backgrounds.
8. Bollinger bands
Bollinger Bands, developed in the 1980s by well-known technical analyst and trader John Bollinger, are one of the most common indicators crypto traders use to assess volatility fluctuations and identify potential points of interest for buying or selling.
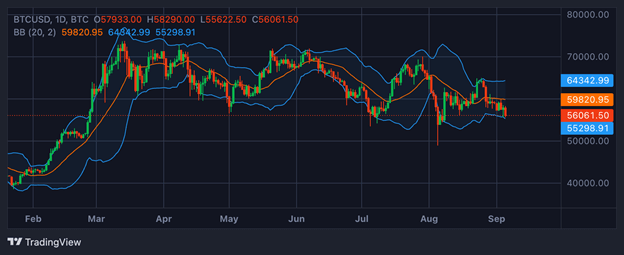
Two of the outer bands reflect price deviation, and the inner line-ma is the simplest or simple moving average that shows the average price of an asset over a certain period. These bands dynamically act: they grow during high volatility and shrink when volatility is low.
An approach or cross of the price above the upper band might indicate overbought conditions and a potential sell. On the other hand, an approach by the price or a level below the lower band may suggest an oversold situation-a buy opportunity. This strategy can be complemented with other indicators for a comprehensive market study.
Pros and Cons of Bollinger Bands
The immediate benefits of the Bollinger Bands are that they are simple and give clear trading signals, allowing for pinpointing particular points of entrance or exit from transactions. Due to their dynamic character, their applicability increases—the bands always keep them in line with the current market’s volatility.
Bollinger Bands are not without their drawbacks. They do not predict future price movements but provide views of past price actions. They work best when combined with other reliable indicators, as they can only give a correct view of the market situation now and then. During periods of low volatility, it may give false indications due to whipsawing as the price continually hits the bands, misleading the traders regarding the market’s direction.
FAQs
What are some of the most important technical indicators in crypto trading?
Leading indicators are part of the whole technical analysis set to at least give a guess about future positions. The RSI, MACD, and Stochastic Oscillator are famous leading indicators in crypto trading. These will provide insight into market trends before they happen.
How do you trade cryptocurrencies?
There is not one “best” because it depends primarily on how you want to trade, how much risk you are willing to take, and your goals. Some main ways of trading cryptocurrencies include swing, trend watching, and day trading. It’s good to try a few different ways of trading and choose the one that best fits you.
Which one is the best indicator to trade?
This may be more than one indicator that works best across different market scenarios. The utility of an indicator changes with a product and a market. Using more than one indicator, like RSI, MACD, and Bollinger Bands, is often suggested to get insight with a reduced probability of false indications.
Which is the most reliable indicator?
The dependability of an indicator may be changed by the product being traded and its market status. On the other hand, the RSI, MACD, and Bollinger Bands are accepted crypto trading indicators. Many traders use them because they help them identify potential price fluctuations and trends.
What are the four main types of indicators?
Indicators used in technical analysis can be differentiated into four primary types: trend indicators, which describe the direction of the market trend; momentum indicators, which measure the speed at which prices move and their intensity; volatility indicators, which show the depth of price changes; and volume indicators, which are regarded as following the volume of trading in financial markets.


