
A bull trap is a short-term rise in the price of an asset that deceives traders into thinking that a price breakout is on the way but soon reverses itself to trap these buyers in a losing trade. Other names of bull trap include dead cat bounce, suckers’ rally, and fake out.
Bull Trap Meaning
A bull trap happens when an asset that is on a downtrend experiences a brief increase in price which lures traders to buy thinking that a reversal is coming. The main downtrend soon resumes, with the price quickly reversing downwards. These bullish traders have thus been fooled into adding long positions and have incurred losses. The term got its name as these “bulls” are “trapped”, and often would be forced to cut losses and this further sends the price of the asset falling deeper into the red.
Bull Trap vs Bear Trap
As the name implies, a bull trap captures bulls, while a bear trap captures bears. Just as a bull trap is when prices go up briefly in a downtrend to fool buyers into buying high, a bear trap is a temporary price decline in an uptrend which fools bearish traders to sell or even open short positions, only to reverse sharply and make these sellers incur losses as the bullish trend resumes.
How do you Identify a Bull Trap?
While it is difficult to spot a bull trap using the naked eye, a bull trap typically has the following few tell-tale signs.
- A bull trap typically occurs when the price is in a downtrend.
- The price moves above its resistance level only for a brief period of time, often lasting for not more than a day.
- The breakout is not supported by any positive fundamental reason, eg. no positive news regarding the asset.
- The breakout is not accompanied by a rise in volume.
One helpful tool traders can use to identify a bull trap with good accuracy is the RSI Oscillator on the technical chart. The RSI indicator can often help traders ascertain the possibility of a breakout being a bull trap by revealing if the asset is overbought.
How RSI can help Identify a Bull Trap
One reliable way of telling whether a breakout could be a bull trap would be to analyse the price increase in conjunction with the RSI oscillator. The RSI indicates whether an asset is overbought or oversold. When the RSI of an asset is above 70, it is a sign that it is overbought, while an RSI of 30 and below would indicate that it is oversold.
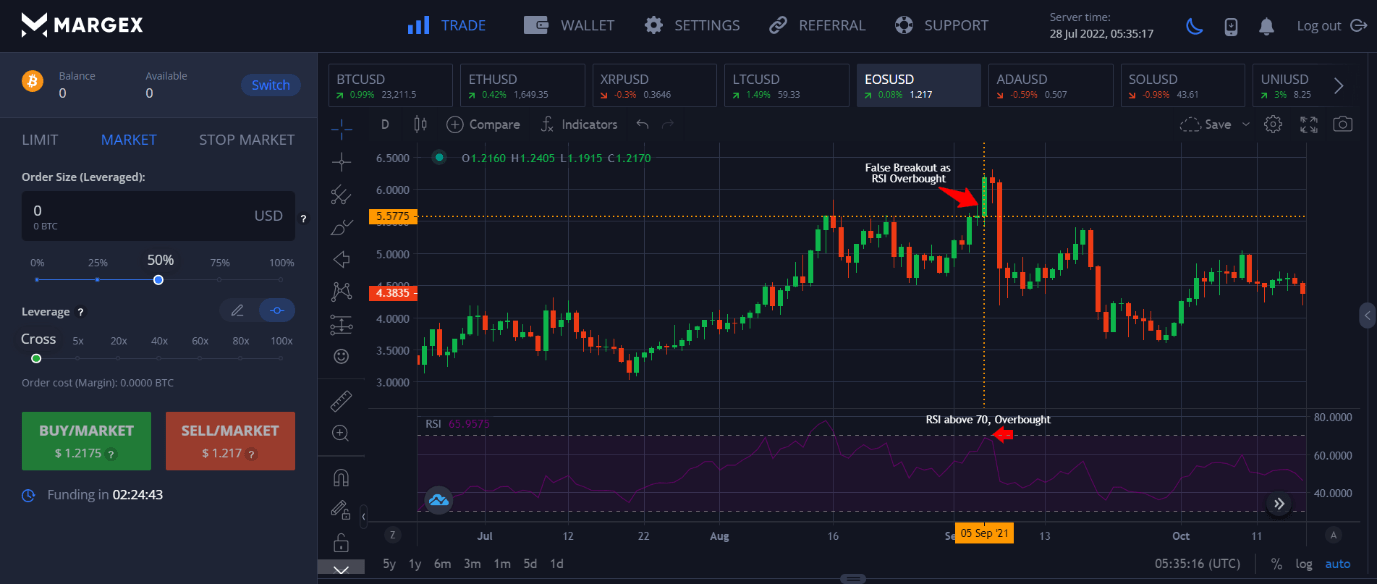
In the above example of EOS, price did a false breakout above its level of resistance of $5.5775 and moved further upwards. However, as the RSI was already overbought, price came crashing down the following day as the overbought situation could not sustain the price increase.
How to Escape a Bull Trap When Trading
While technical indicators can help traders spot bull traps with a high success rate, there are also other ways to help a trader protect his portfolio from being hit with one.
Putting Stop Losses
Setting a stop-loss on your long position is the best way a trader can escape a bull trap in trading. This will help you prevent heavy losses even if you are unlucky enough to be caught in one.
Stop-losses can help you close out your long trade when the price drops to a certain level specified by you to stop you from losing more money as the price moves more unfavourably against you.
Controlling Your Emotions
The other way to escape a bull trap in trading is to avoid getting caught up in one by exercising prudence and patience in your trading.
Often, traders get caught in a bull trap because of an over-zealous urge to want to be the first to enter a trade. These emotions often get in the way of many traders as the instinct to want to be ahead of the pack, or the psychological need of wanting to catch a good bargain comes in to affect the trader’s decision. Do not let feelings of FOMO or fear lead you to trade, but rather, exercise patience and keep looking out for technical indicators on the chart to show you good entry levels to reduce your risk of losing money.
Examples of Bull Traps on Crypto Market 2022
Now that we have explained what is a bull trap, let us take a look at some examples of bull traps in the crypto market this year.
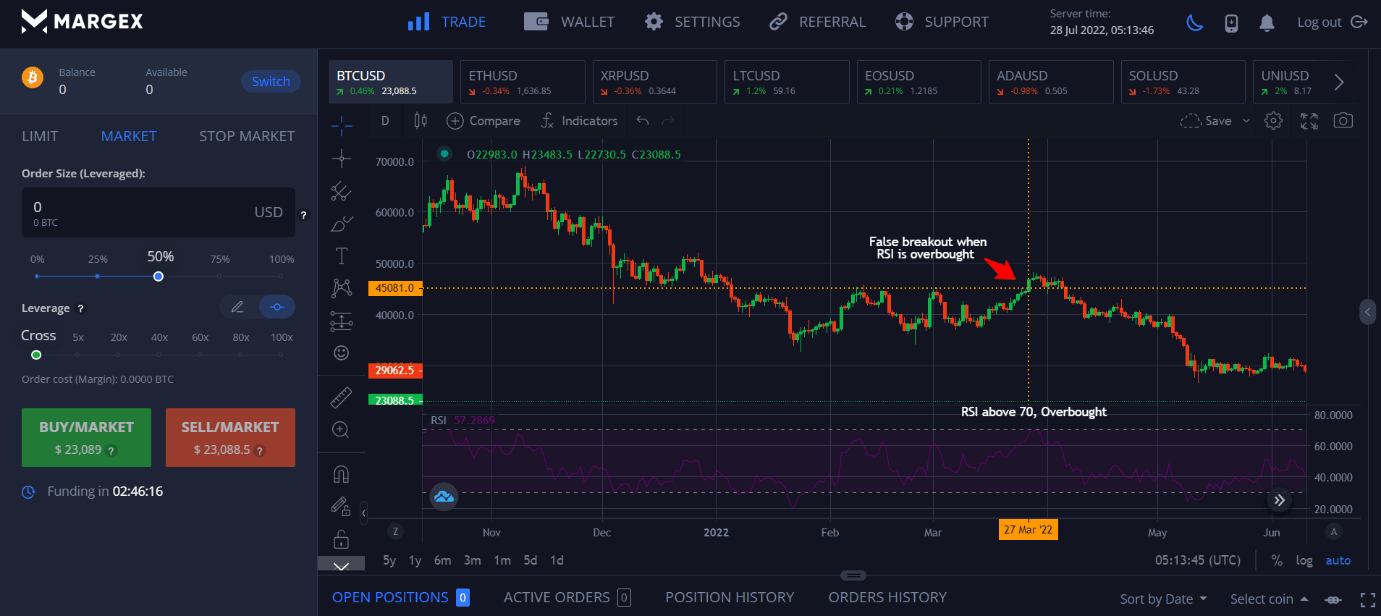
BTC Bull Trap of March 2022
BTC had an infamous bull trap this March that tricked many traders to buy before the price tanked sharply in May. Looking at the diagram below, one can see that on 27 March 2022, the price of BTC broke out of its resistance of $45,000 strongly. However, at that point in time, the RSI was at already at an overbought level of 70. The rally soon fizzled out and price started declining shortly afterwards. Bulls who had been trapped waited for the price to rebound so they could get out of their trade without a loss, but that opportunity never came. As the trapped bulls began to cut their losses, the impact caused the price of BTC to break its support at $35,000 and dipped further to $29,000.
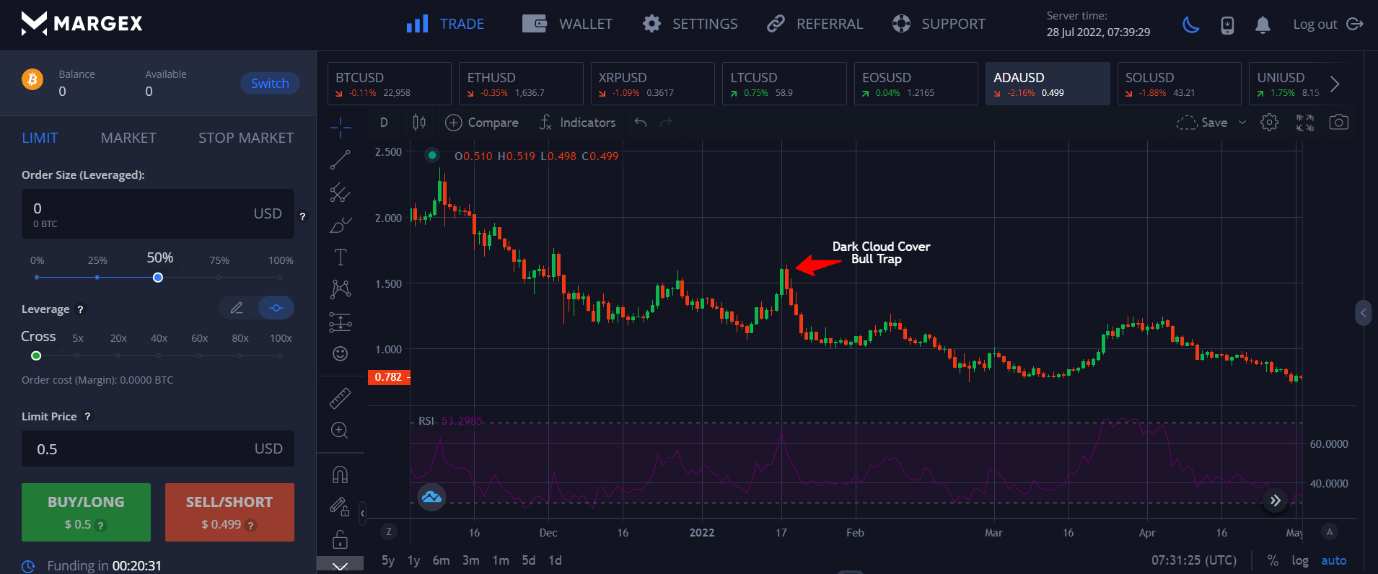
ADA Bull Trap Feb 2022
In the next example, we look at ADA, which did a bull trap in February 2022. Similar with the BTC example above, ADA made a false breakout which even closed above the resistance of $1.50 on the day. However, once the market opened the next day, a bearish candlestick pattern called dark cloud cover formed over the chart and sent the price of ADA tumbling back down over the next several days. This dark cloud cover formation was also preceded by a very steep rise in the RSI from neutral to overbought over just one day, which was too much and too fast to be sustainable.
How to trade a bull trap on Margex?
The Margex platform offers the necessary technical tools to help a anyone effectively trade a bull trap. However, this is not financial advice, and a trader should consider his own financial situation before doing transactions in any financial instrument. Past performance is also not indicative of future results and this demonstration should also not be viewed as a solicitation to trade. If unsure, please seek advice from your independent financial advisor. Trading in leveraged financial instruments may come with a high risk of losing money and thus, traders are advised to exercise prudence and do not trade more than what you can comfortably afford to lose.
Now that we are done with the disclaimer, let us get into the basics on how we should trade a bull trap.
As we are aware by now, a bull trap often results in a sharp downward decline in prices after the short-term upside has managed to trap the bulls. Hence, one of the ways a trader could profit from a bull trap is to do a short sell trade after he identifies a bull trap. Below is a step-by-step guide on how to trade a bull trap on Margex.
Step 1: Open a trading account at Margex by going to its website at https://margex.com/.
Click the top right-hand corner to register for an account. After your account has been successfully opened, which takes only about 30 seconds, you may log in to your account to start trading!
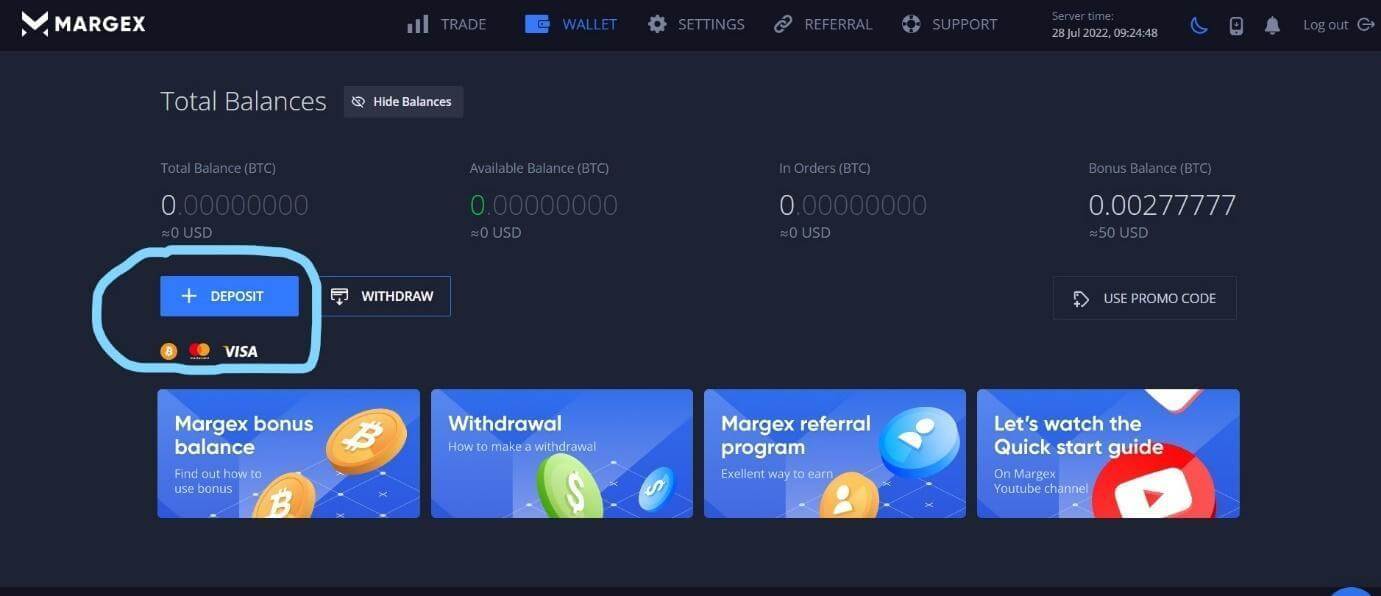
Step 2: Fund your account by clicking on the “Deposit” button as shown under the “Wallet” tab located on the top navigation bar. You may deposit in a variety of ways like Visa, Mastercard, or even in Bitcoin!
Step 3: On the Margex trading screen, you may freely access the technical tools available to analyse any crypto trading pair you like. Click on the “Trade” tab on the top navigation bar and you will be able to see and use Margex’s suite of technical charting tools to help you identify bull traps to short.
Step 4: After identifying the pair you want to short, simply key in your desired order size and the price you want to short at in the order ticket on the left of the screen shown below.
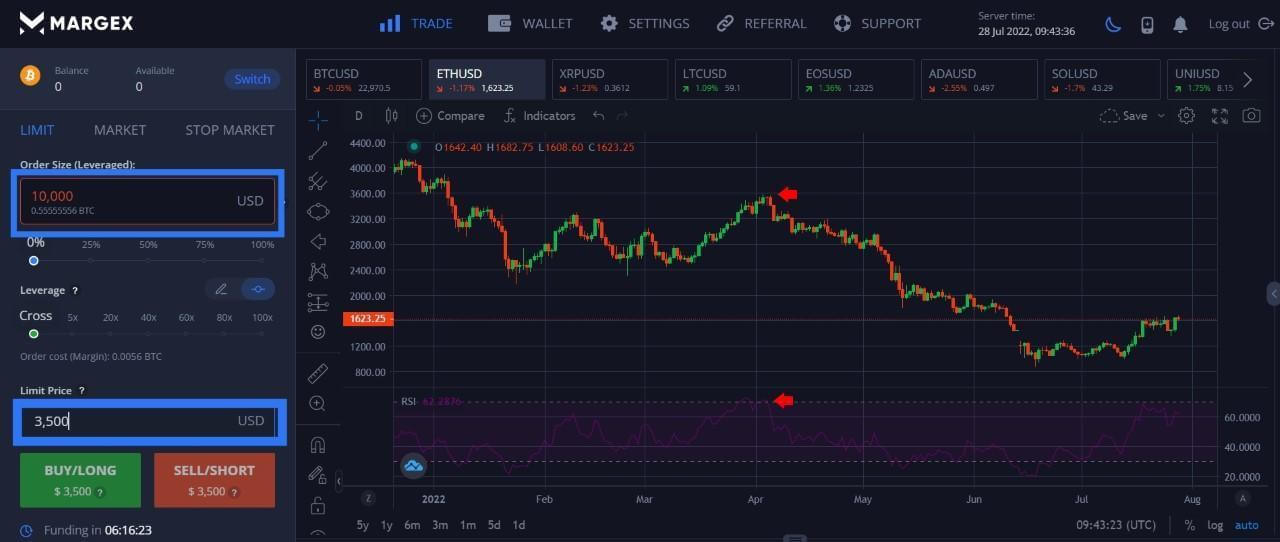
Following the example of ETH above, once you identify a good price to short, which is around $3,500, enter your desired shorting price into the “Limit Price” field (bottom blue rectangle). After that, enter the amount you wish to short in the “Order Size” field (top blue rectangle).
Please bear in mind that the trades are leveraged and do exercise risk management when doing leveraged trading and do not trade more than what you can afford to lose. If you opt for a high leverage, there is a chance that your losses may exceed your initial deposit.
In the case of this example, as the price of ETH made a false break at $3,500 with the RSI above 70, this would make a good short sell trade. Note also that there is a bearish engulfing candlestick appearing on the day of the bearish reversal, which reinforces the bearish view.
As part of risk management, we should always use a stop-loss in our trading. A stop-loss for a bull trap should always be above the prior high point of the green candle on the day when the price made its swing high. In this case, the stop-loss should be above $3,585 which was the prior high price. A stop-loss of around $3,600 should thus suffice. Placing a stop-loss as close as practicable to the prevailing high will minimise the potential loss that may result in case the trade goes the wrong way since nothing can be certain in trading. As a general guide, traders should always keep their stop-losses near to their trade entry points to preserve their trading capital as much as possible. It is often a good idea to cut your losses early to prevent losses from piling up and affecting your overall profit and loss.
FAQ
Now that we have explained how to identify, escape, as well as trade a bull trap, let us do some easy revision exercises to recap what you have learnt.
Is a bull trap bullish or bearish?
A bull trap is bearish because it is meant to traps bulls who think that the market has turned bullish while in the midst of a downtrend.
What happens after a bull trap?
After a bull trap, the price of the asset often does a bearish reversal and falls back sharply lower, trapping the bullish traders who longed in a state of euphoria.
How do you trade a bull trap?
You can trade a bull trap by opening a short position when your technical charting tools have signalled that a bull trap is in effect. Nowadays, the availability of CFDs and futures contracts on trading platforms allow any trader to be able to effectively profit from the powerful downward price move that can occur when the reversal leg of a bull trap plays out. CFDs and futures contracts allow a trader to spread bet on the price change of an asset without the need to own it and is gaining popularity due to the convenience and flexibility they provide to the trader.
What causes a bull trap?
The possible reasons that cause a bull trap are aplenty and it is hard to pinpoint a specific reason what causes one. However, typically, bull traps occur as a result of permanently bullish-biased traders wanting to catch a perceived bullish reversal early but ended up getting caught on the wrong side of the market. Such trades are often taken without a reasonable basis and are usually led by the emotions of the traders. Therefore, traders should endeavour not to let their feelings affect their trading and use logic based technical tools to assist them in their trading to avoid being caught in a bull trap.


