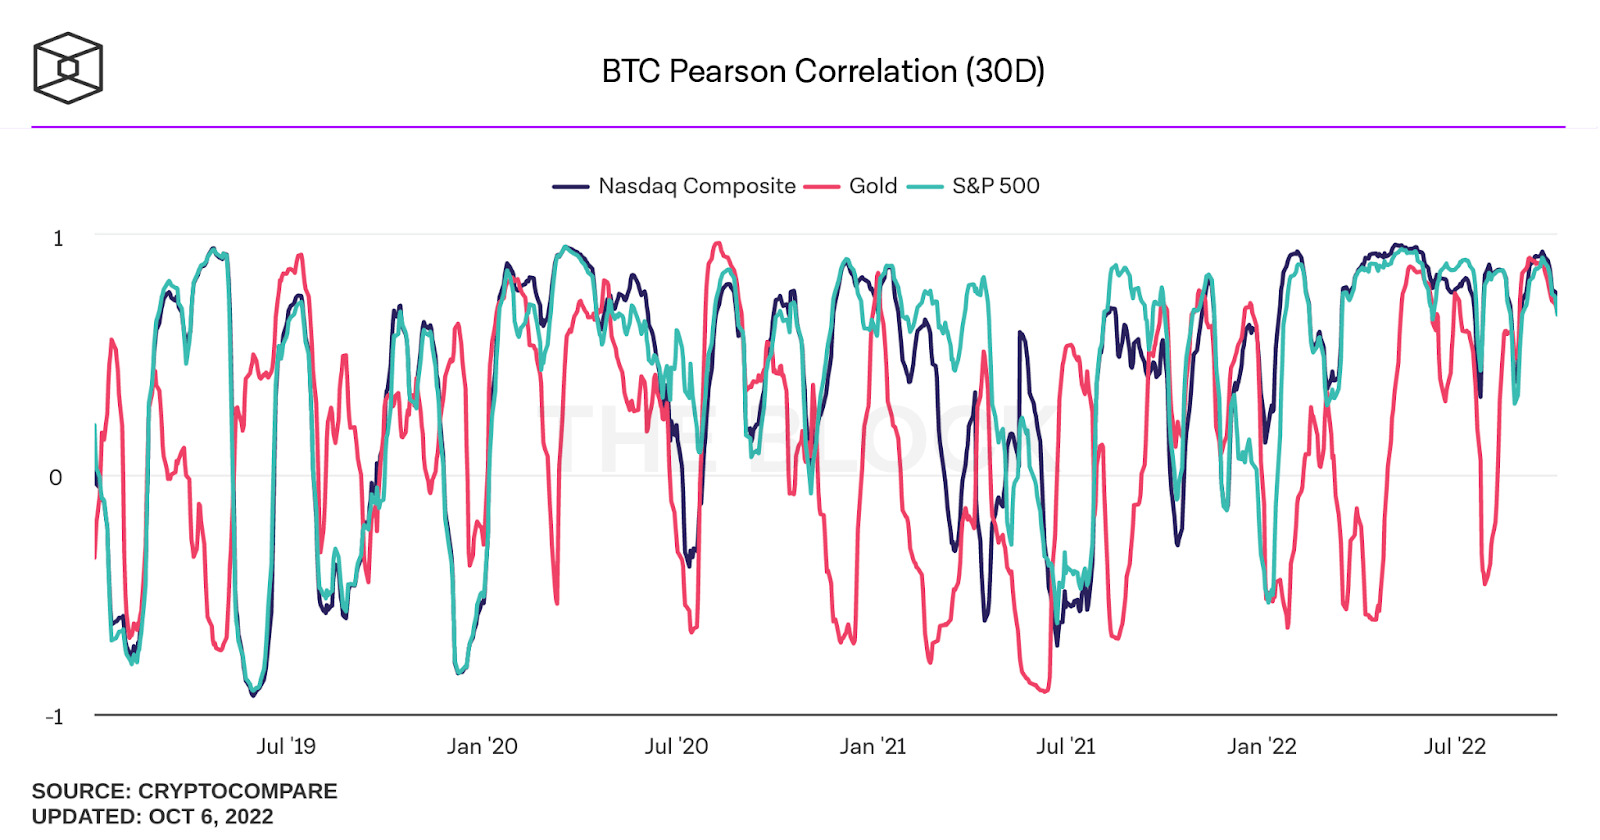
Ever since the recovery in risk assets after the COVID crash of 2020, Bitcoin has been regularly trading at a near 100% correlation with the US stock market, with the only small variation being the relative volatility of each asset - sometimes Bitcoin is more volatile, other times, like the current period, stocks are trading with much higher volatility than Bitcoin.
The below chart from onchain data provider Cryptocompare shows the 30-day rolling correlation of Bitcoin with the Nasdaq, S&P and gold. As can be seen, Bitcoin has had an almost perfect correlation with US stocks since the beginning of 2022, while its correlation with gold has been much less consistent.
With the price of Bitcoin holding firm in the face of a declining stock market recently, some crypto investors are beginning to believe that the worst is over for Bitcoin and that it may have bottomed at around $17,500.
While Bitcoin’s track record may not go back far enough to be able to give investors an idea of where its price could move next, there is a lot of data that could provide hints of where the stock markets could be going, and most observers are not painting a good outcome in the stock markets for the coming year. With Bitcoin’s correlation with the stock market not showing any signs of decoupling, trouble in the stock markets could drag down the price of Bitcoin. Hence, it may be premature to celebrate and think that Bitcoin has bottomed.
Let’s examine some charts that the trading community have been sharing on social media about just how bad the stock markets could be for the months ahead to get an idea of how rough things could go for Bitcoin.
However, please bear in mind that what we are sharing are postings and views of other traders in the global community, and may not necessarily reflect our official view on the markets. The below information is for educational purposes only and is not to be construed as a solicitation to trade.
WallStreetBets Trader Thinks S&P Is Going to Tank
Taken from a July posting in the well-known WallStreetBets Reddit Thread, the below diagram is from trader WildAnimus who has obviously been very bearish on the markets. While the bearish move has not yet come to pass, it has not been negated either. We will need to move deeper into October to know if the same pattern repeats in 2022, as in the 2008 chart, the major crash only started around end-September and took place throughout October.
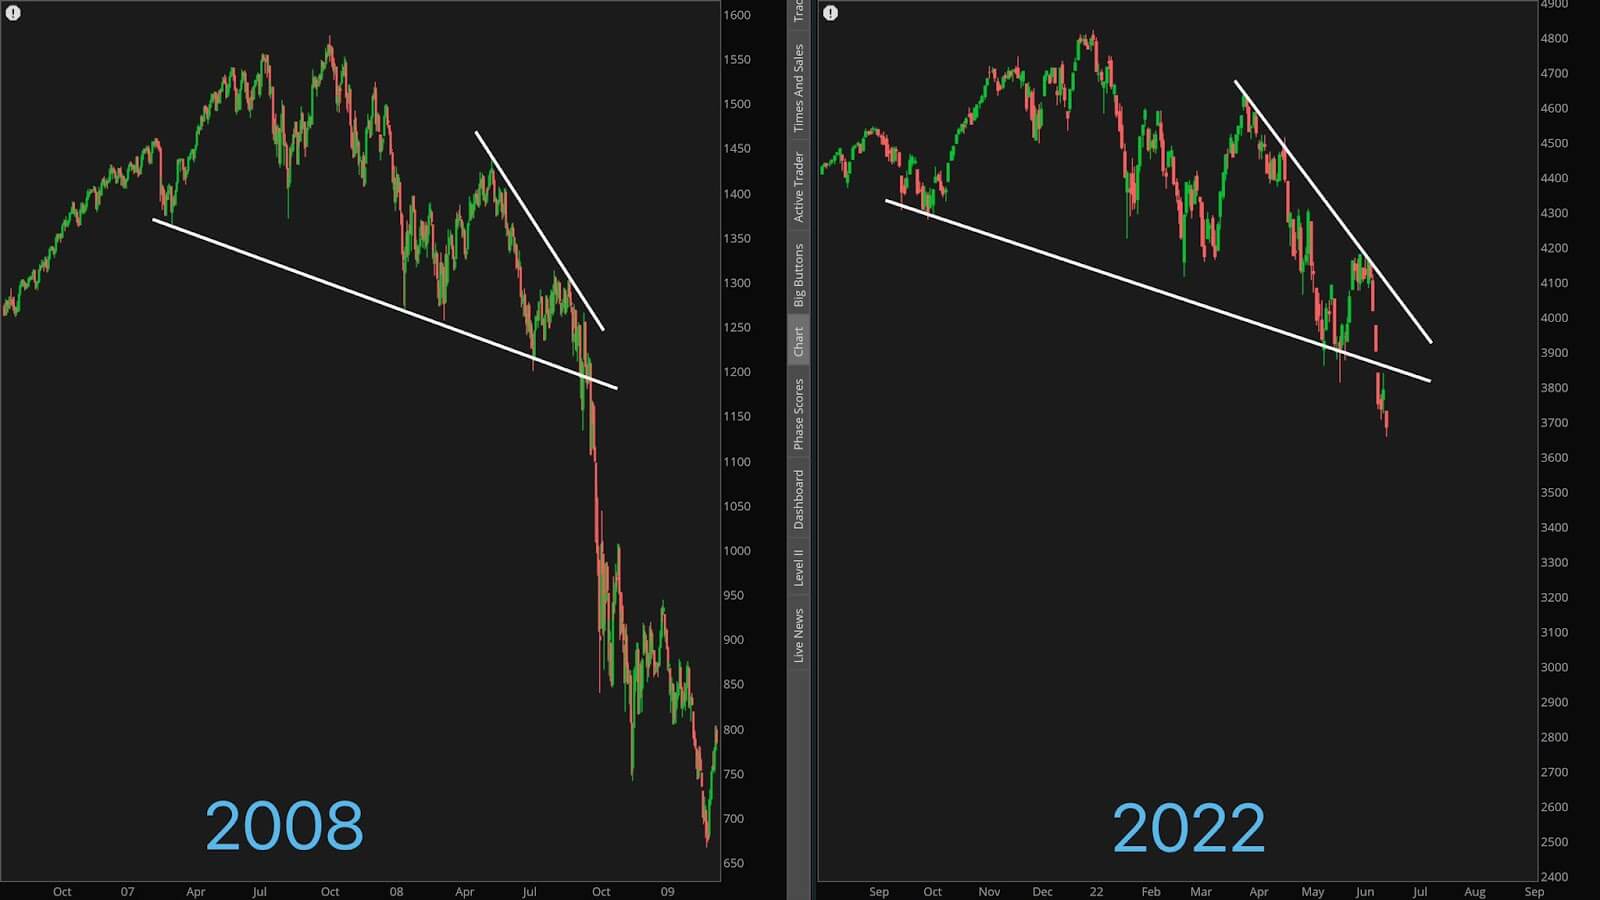
If the S&P were to really follow the trajectory of the above 2008 chart, we could be looking at a potential fall of some 81.5% from current levels.
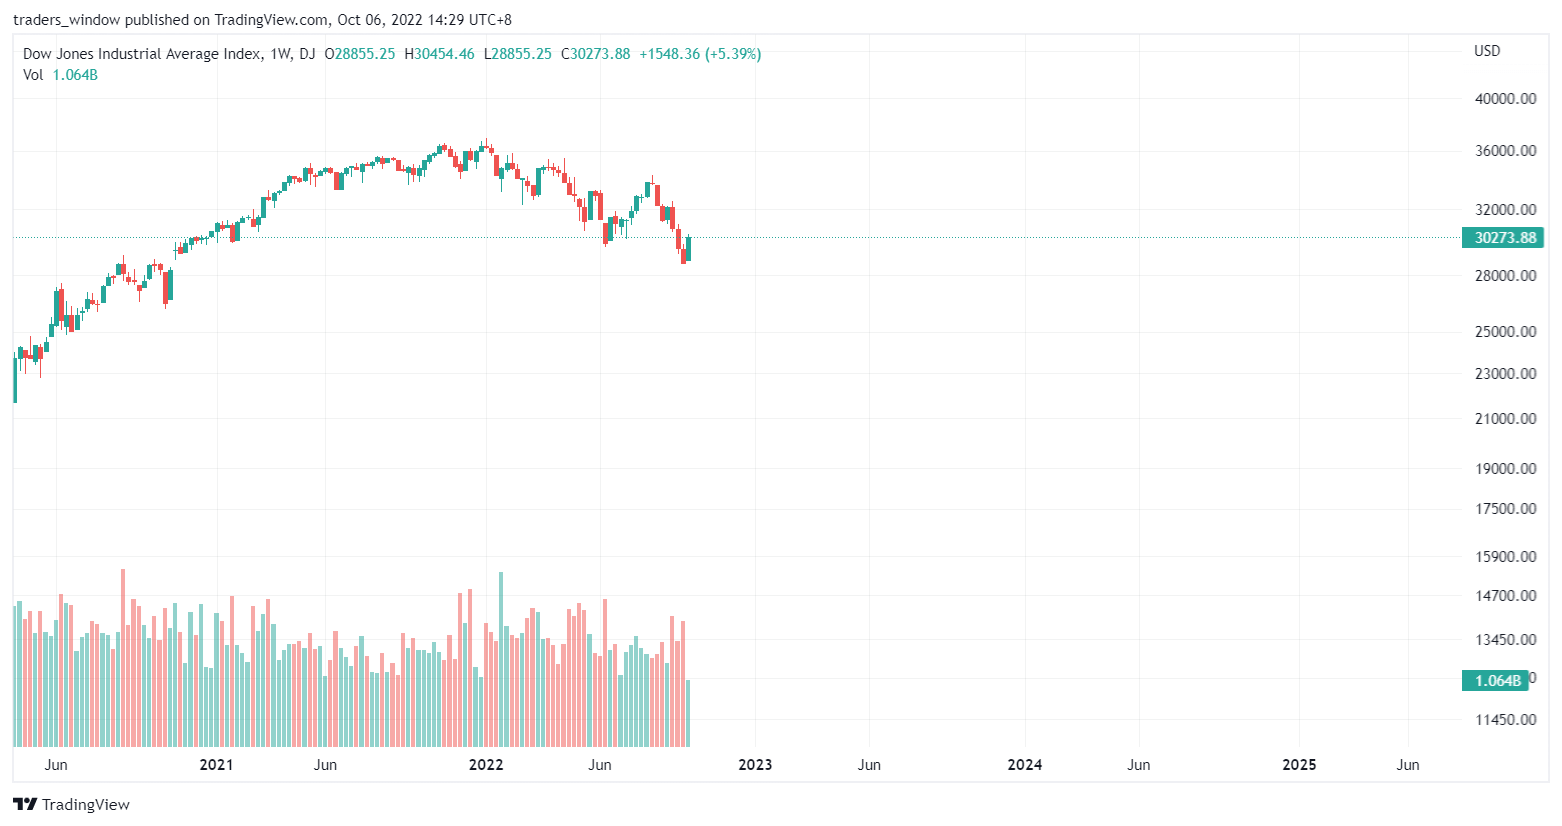
Current Dow Jones Chart May Mimic 1929 Crash
Other traders have used the Dow Jones instead of the S&P chart to warn of the impending apocalypse.
Going further back, these traders compared the current stock market movement to the crash of 1929. There indeed lies some similarities. From the diagram below, one can see that the current Dow Jones chart appears to be an abridged version of the 1929 chart both in terms of magnitude and duration.
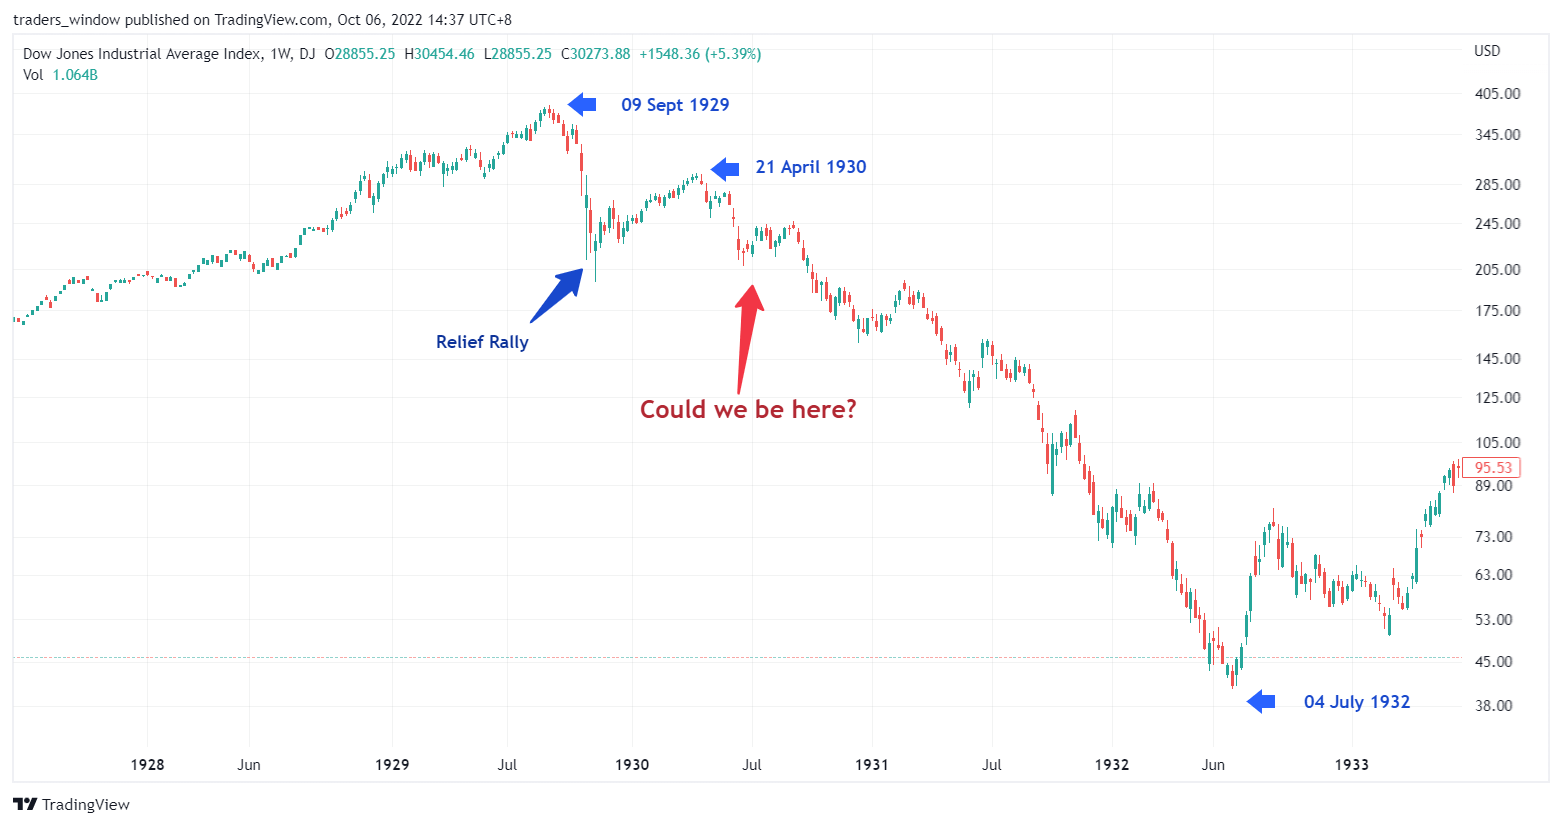
1929 Dow Jones Industrial Index Weekly Chart
If the Dow Jones were to really follow the path of 1929, we could be looking at a potential fall of some 81.6% from current levels, which coincidentally, is a similar percentage loss in the first example of the S&P Index chart!
While we are not sure if this is pure coincidence or sorcery, there indeed exist some events that could cause a broad and major stock market selloff.
Watch Out For Macroeconomic Events
First, there is the uncertainty with the Russian-Ukraine-NATO situation, which has been deteriorating and may drag more countries into the conflict. Secondly, the US Fed is hiking rates aggressively and committed to not slow it down until inflation eases back to 2% even if it means an economic slowdown. Thirdly, the strength of the US dollar is causing other currencies in the emerging markets to fall drastically, which may affect their economies negatively. Fourthly, there is the energy crisis in Europe that is expected to cripple the Eurozone come winter, and then there is the possibility of more China lockdowns due to COVID cases resurging that could disrupt supply chains. Further to all these, oil prices are rising again as winter approaches and now we even have Credit Suisse, one of the largest banks in the world, possibly going bankrupt. The reasons for a possible mishap are just too many to ignore.
Hence, while we are not necessarily bearish on Bitcoin, it may be prudent for the Bitcoin investor to keep in view the broad macroeconomic events that may trigger a negative price move on Bitcoin. Should something break in the bigger picture and a deleveraging event like the COVID crash occurs again, Bitcoin may not be spared. However, the bright side of this will be that it will present a great opportunity to pick up more Bitcoin on the cheap.