Most crypto traders who have spent a good period in the crypto market begin to understand how powerful it can be to harness the skills of technical analysis, be it for intraday or long-term trading, as the price actions and volatility of the can quickly go against you.
For example, the price of Bitcoin rose from $30,000 and rallied to a high of $69,000 in November 2021. Since then, we have seen a constant decline from that region to a point at which Bitcoin trades at $20,000.
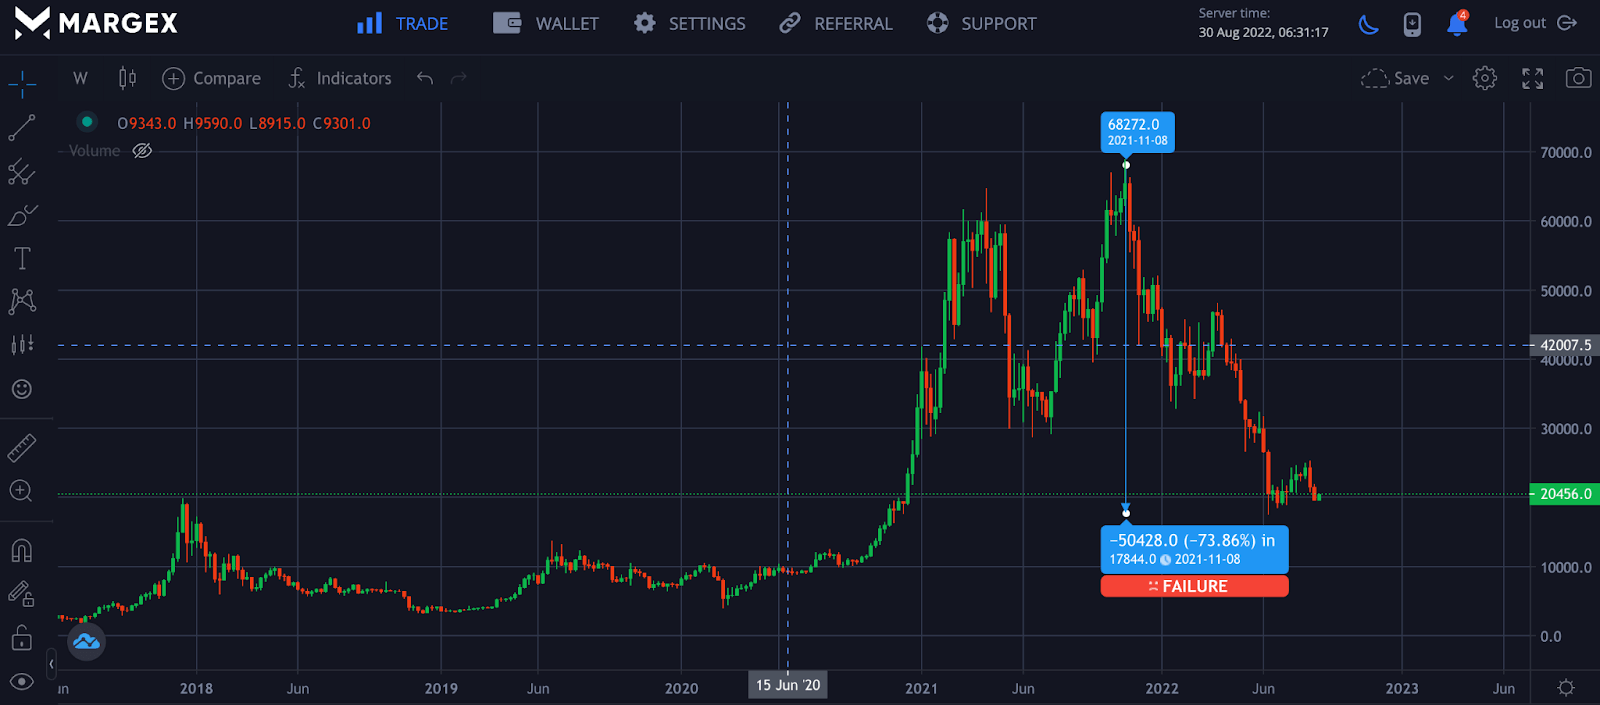
The Bitcoin chart shows a drop of over 70% from its all-time high, suggesting the need to learn technical analysis tools, strategies, and Indicators to best forecast the price movements of these assets for better and more efficient return on investment (ROI).
Some technical analysis tools include chart patterns and indicators such as the Relative Strength Index (RSI) and moving averages for better profitability.
Moving averages is a tool used by most traders in crypto, forex, and stock markets to nest time their entries, exits, and trend directions and use dynamic support and resistances based on the timeframe and the type of trader.
This guide focuses on moving averages strategies, the best moving average strategy for short-term and long-term trends, how to time your entries and exits, and how to use dynamic support and resistance to improve your chances of higher profit success.
Technical Analysis Of The Financial Market
Technical analysis is a framework used by traders to determine price movements and forecast the best trading opportunities based on market trends and volume.
To scrutinize the demand and supply of these assets, volume and other technical indicators are employed—such as moving averages, trendlines, channels, and momentum indicators.
Some of these indicators are focused on identifying market trends, either short-term or long-term trends, and their strengths, while others are used to time entries, exits, support, and resistances.
The idea of technical market analysis is based on three common assumptions; the market discounts everything, prices move in trends, and history repeats itself.
In-depth knowledge of technical analysis in the cryptocurrency community separates many individuals who claim to be traders as their knowledge could be exposed in a low volatile situation or bear market. Building a profitable trading strategy will help a trader manage risk, improve profitability and success, and help you to keep profits in check.
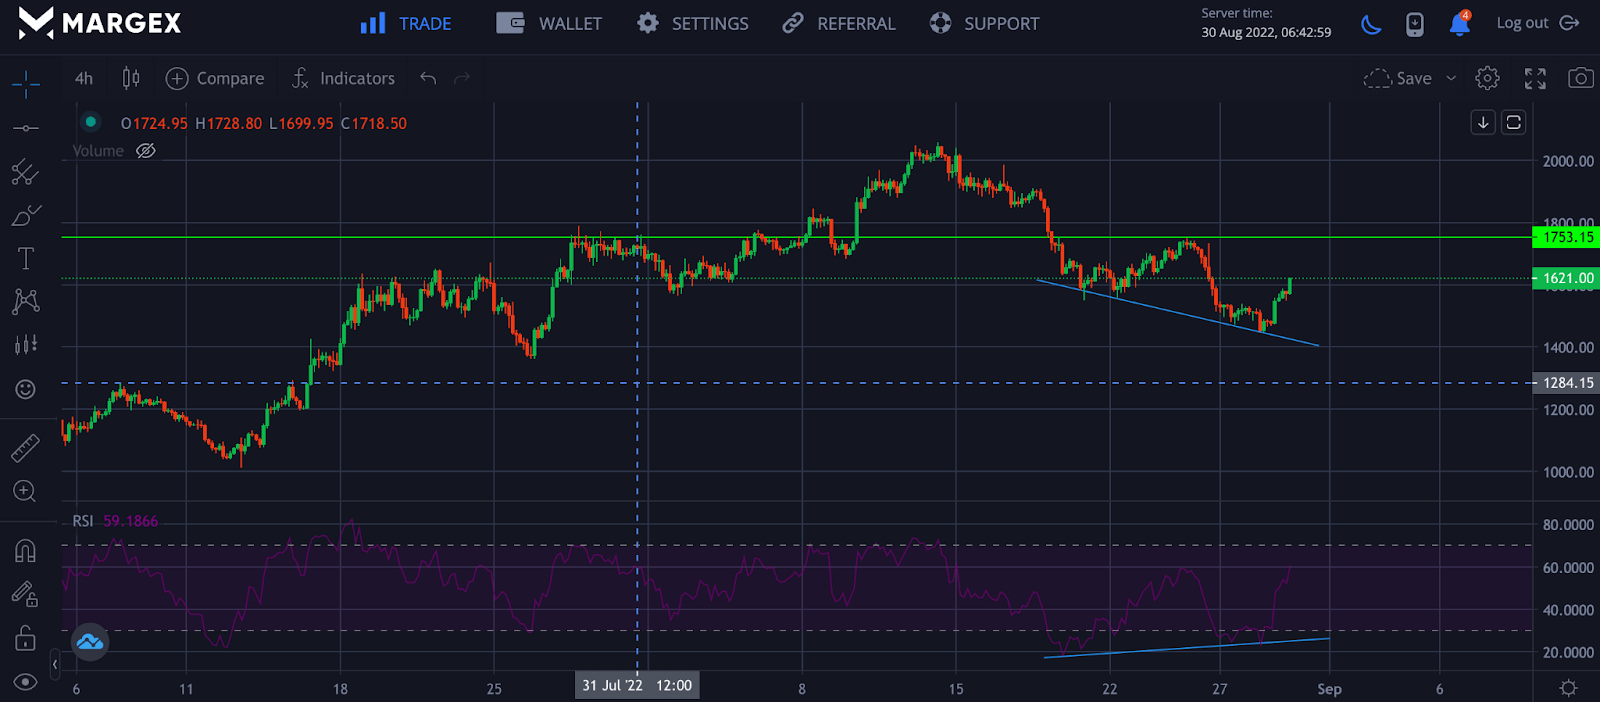
The chart above shows a bullish divergence as one of the chart patterns employed by a technical analyst to predict short-term price reversal on the four hourly (4H) timeframe, while a target is set to be the first major resistance on the daily chart.
With the background knowledge of technical analysis, let us focus extensively on moving averages and how applying different strategies will help you leverage opportunities in the crypto market.
What Is A Moving Average (MA)?
Moving average (MA) is one of the most commonly used technical indicators by traders in the financial market to smooth out price data by creating an average price closed over a period.
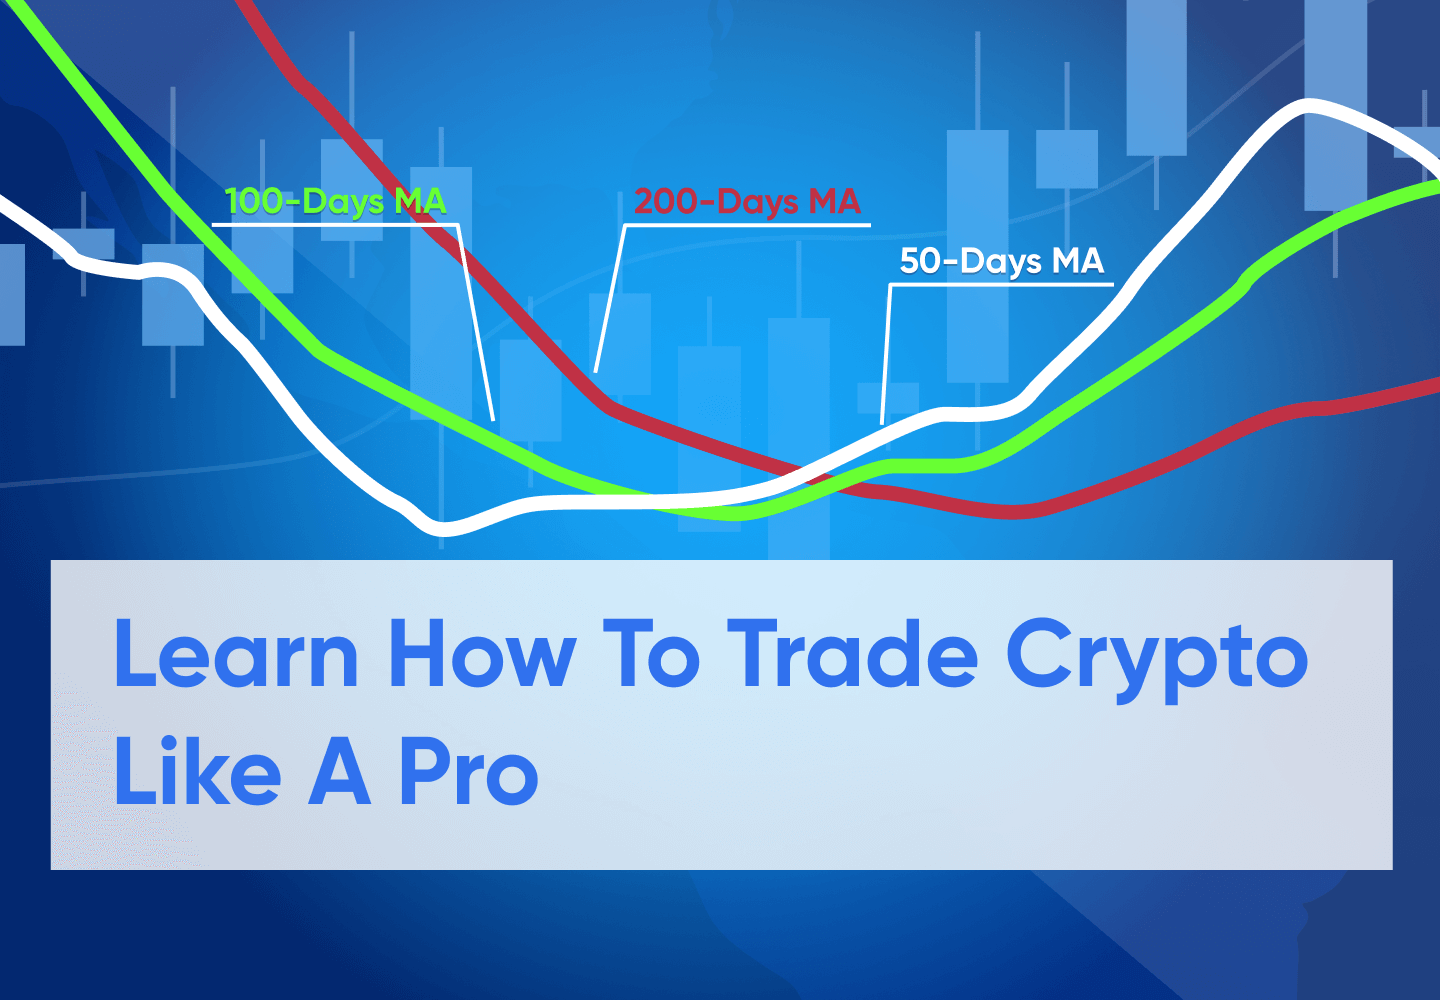
To determine the market trends, traders employ moving averages as an arsenal to navigate price movements, volatility, and the different trends the market has found itself. To ride long-term trends, traders would seek 20-day, 50-day, and 200-day moving averages depending on the timeframe the trader decides to go with, while they would go with 50-day, 100-day, and 200-day moving averages.
Crypto traders use the 50-day, 100-day, and 200-day moving averages to filter price noises and enter and exit long-term trends based on either double moving average crossover or triple moving average crossover.
Other traders could go for 50-day and 200-day moving averages depending on their preferences and what works best with their strategies.
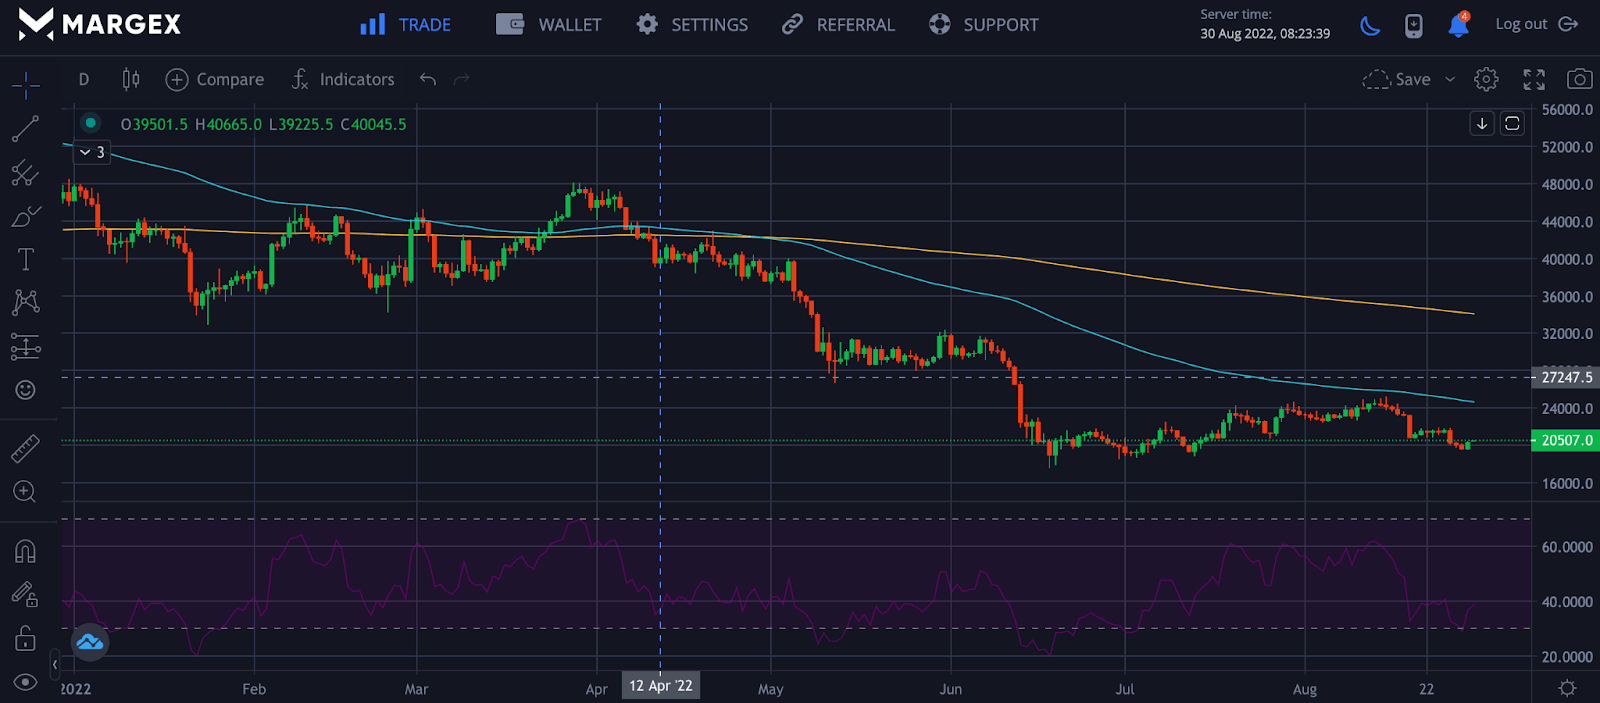
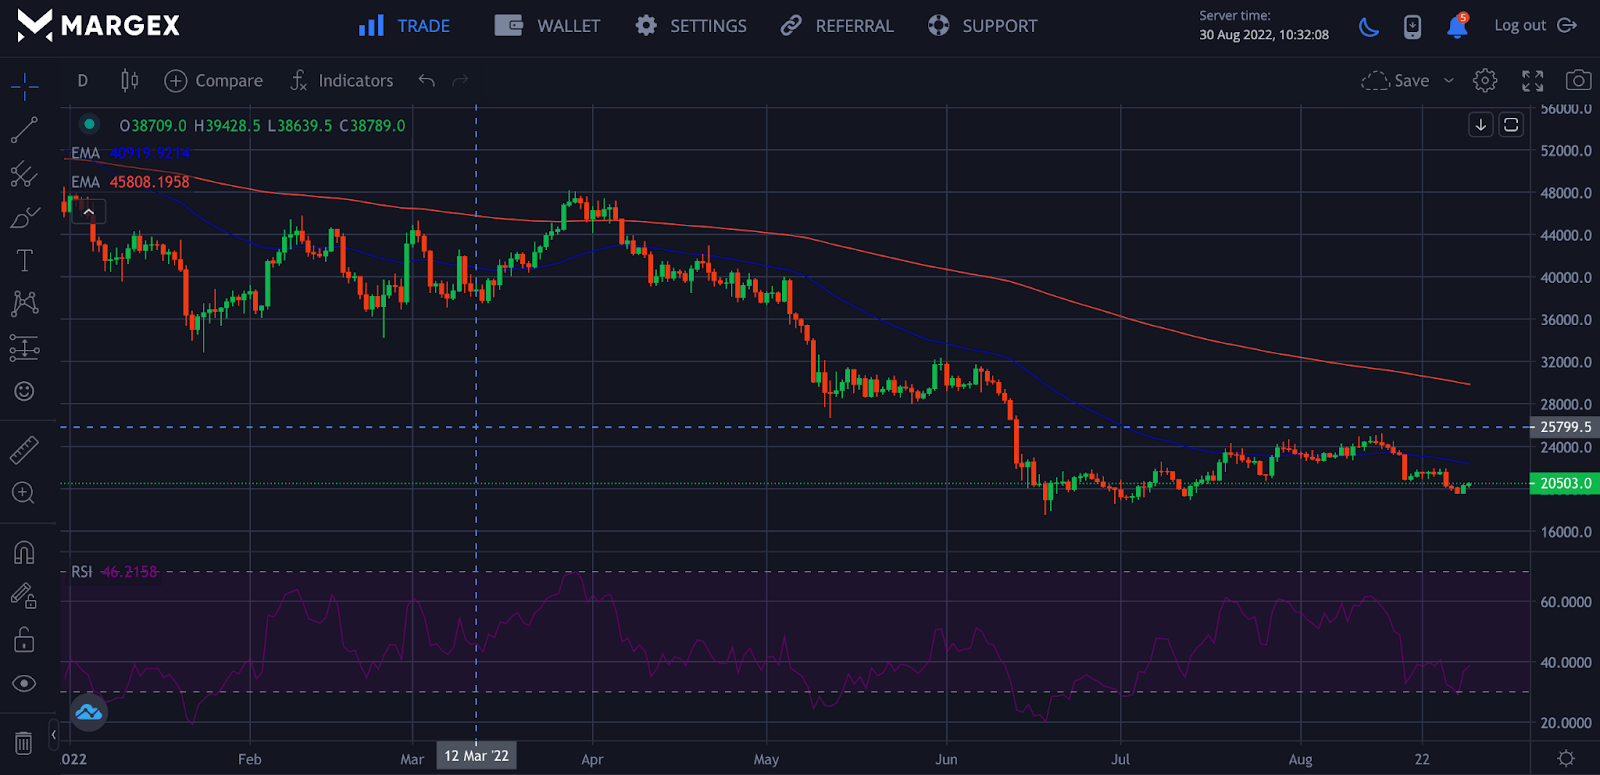
The chart shows a downward or bearish trend movement for the BTCUSD pair with the help of the 50-day and 200-day moving averages.
There are different moving averages; we will focus on the common ones. These include Exponential Moving Average (EMA), Simple Moving Average (SMA), and Moving Average Convergence Divergence (MACD).
Simple Moving Average
As the name implies, this is the easiest moving average where averages are obtained from the period closing prices over a fixed time. For instance, if a trader chooses a timeframe of two hours (2H), the simple moving average would be the closing prices of candles over the last ten hours.
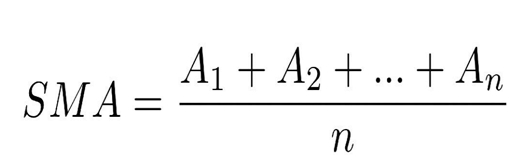
A = Sum of all closed prices over a period
n = Number of closed prices
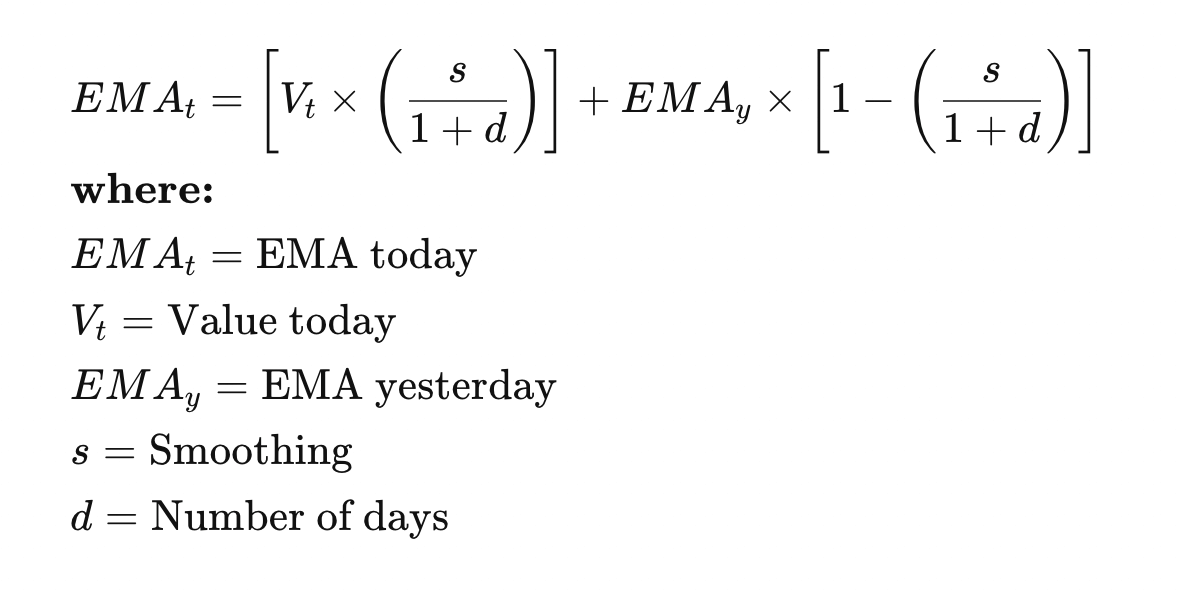
Exponential Moving Average (EMA)
Exponential moving average, also known as weighted moving average, is an indicator used by traders because of how effective and more accurate than the simple moving average. It measures the current price change and reacts faster to changes in an asset's trend direction than the simple moving average.
Moving Average Convergence Divergence
Moving average convergence divergence, also known as (MACD) is a technical indicator tool used for trends and momentum because of its simplicity and flexibility. The concept adopted for MACD makes it more exciting and adaptable for most traders.
MACD is obtained due to the difference in price between the 26-day exponential moving average (EMA) and the 12-day exponential moving average (EMA). The 12-day EMA is the faster-moving average, while the 26-day EMA is the slower-moving average. Both MACD values use the closing prices over a period the trader uses.
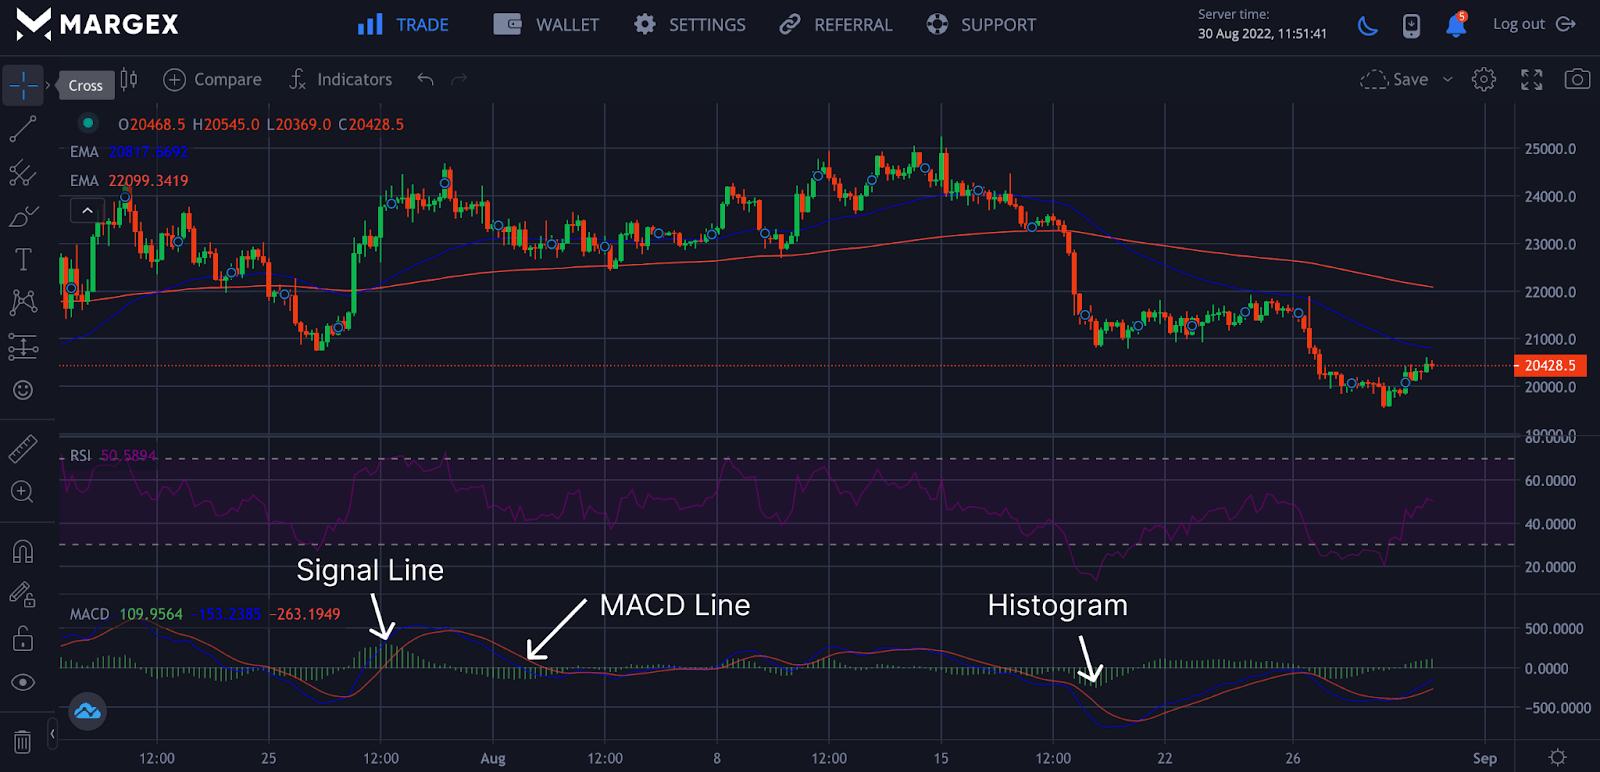
Signal Line: This is the fast moving average and the average of the closing price over the last 12-days.
MACD Line: This is the slow moving average and the difference between the 26-day exponential moving average and the 12-day exponential moving average. These are the closing prices of the candles over the desired date. The 9-day EMA represents the value for the difference between 26-day EMA and 12-day EMA.
The difference in price movement between the 9-day EMA and the 12-day EMA gives us the histogram, the more significant the difference, the bigger the histogram.
Using the MACD alone can lead to irregular trading and huge losses; using other reliable trading strategies is advised. Using the MACD strategy with divergences can be quite successful.
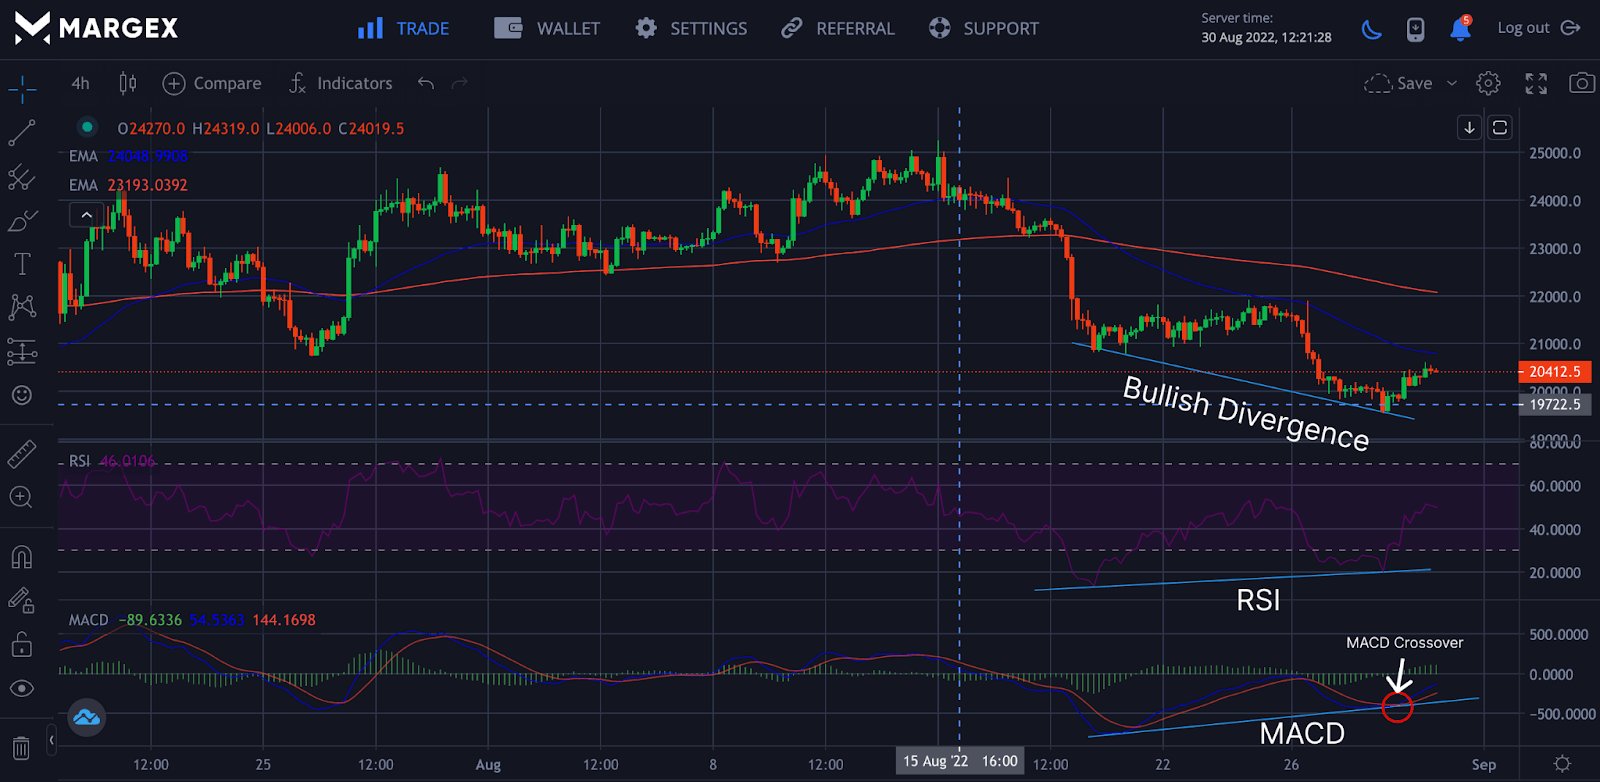
Bullish divergences are technical analysis patterns used by traders to confirm a downtrend reversal or a possible momentum shift is about to occur.
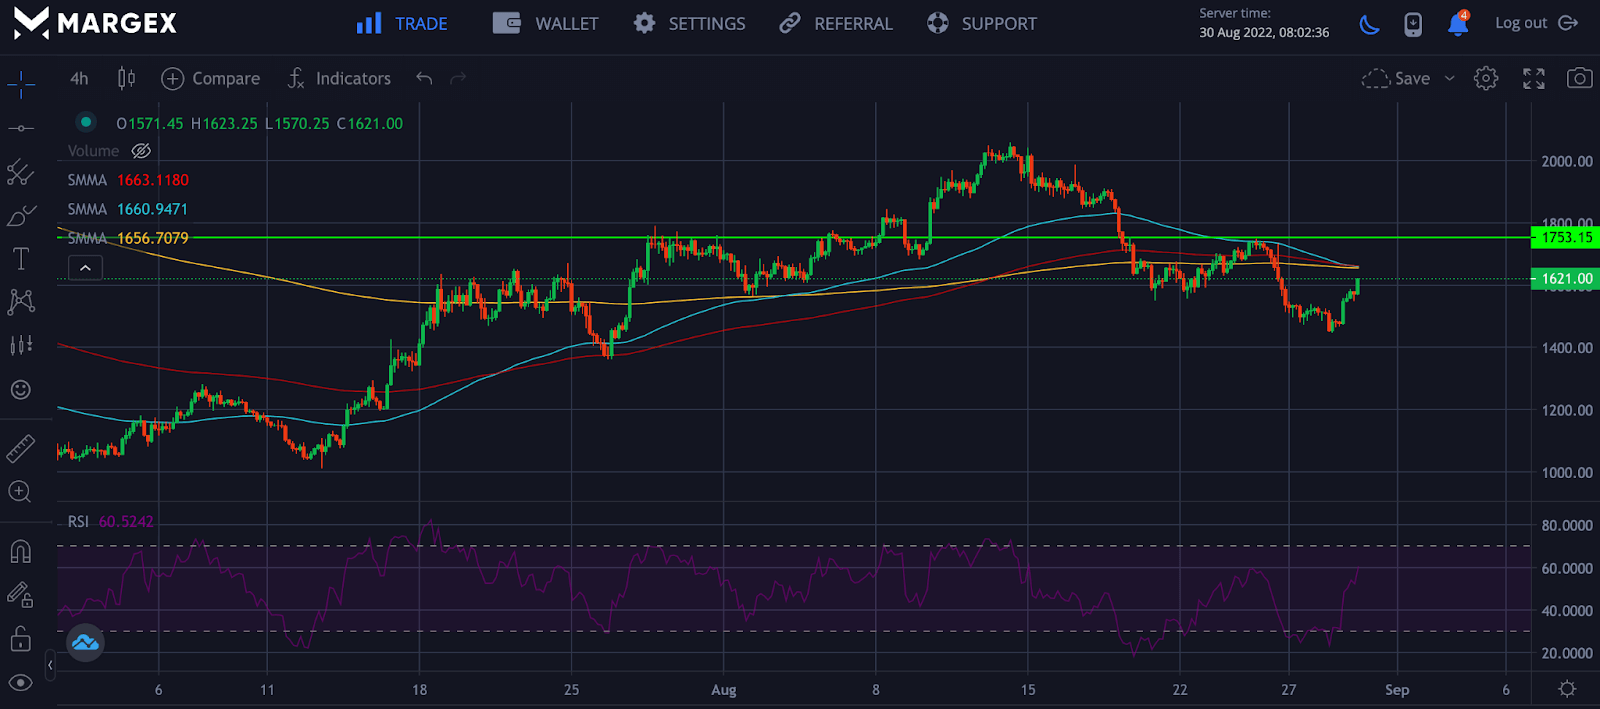
The relative strength index confirms bullish or bearish divergences, so it is with MACD. On confirmation of the pattern formed, a bullish reversal is imminent; the red circle showed the trend reversal with the MACD crossover, which led to the ETHUSD pair changing momentum to the upside based on the 4H chart.
Best Moving Average Settings For Crypto Traders On Margex
Finding the best moving average setting can sometimes be challenging, especially for beginner traders, but setting up the best moving averages solely depends on the type and personality of the trader.
Whether as a day trader or swing trader selecting your preferences for moving averages can serve different purposes. Moving averages are not to be used alone as a trading strategy; rather, they need to be combined with other proven strategies or techniques that have been tested to have worked. Choosing the right moving averages based on techniques can add reliability to your trading and profitability. Still, a poor choice of moving average selection or misaligned setting could affect your profitability.
The moving average setting has been devised for traders ranging from scalpers, day traders, swing traders, and long-term traders. On the Margex platform, we will set the moving averages for scalpers, day traders, and swing traders.
Scalp Trading
Traders known as scalpers profit from small price movement under a low timeframe of five minutes to thirty minutes (5m-30m). Scalpers combine two or more moving averages or techniques to find the most profitable set while executing it at the fastest time.
The 5-day, 8-day, and 13-day (5-8-13) moving averages are good for buying and selling crypto assets under lower timeframes.
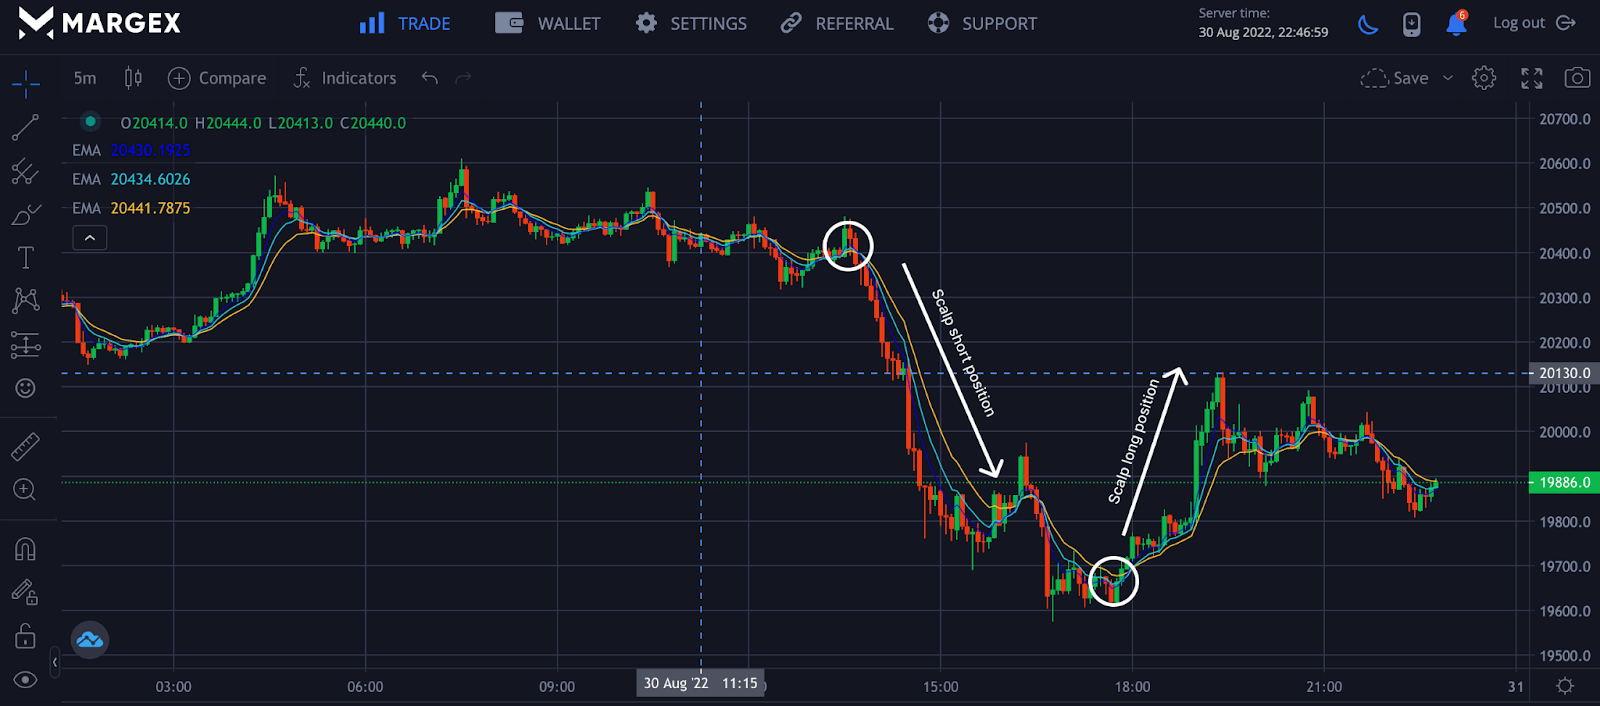
Using the 5 minutes chart with the setting of (5-8-13), scalp traders can look for the best entries on crossovers of the moving averages and would exit the position on a break of the trend structure.
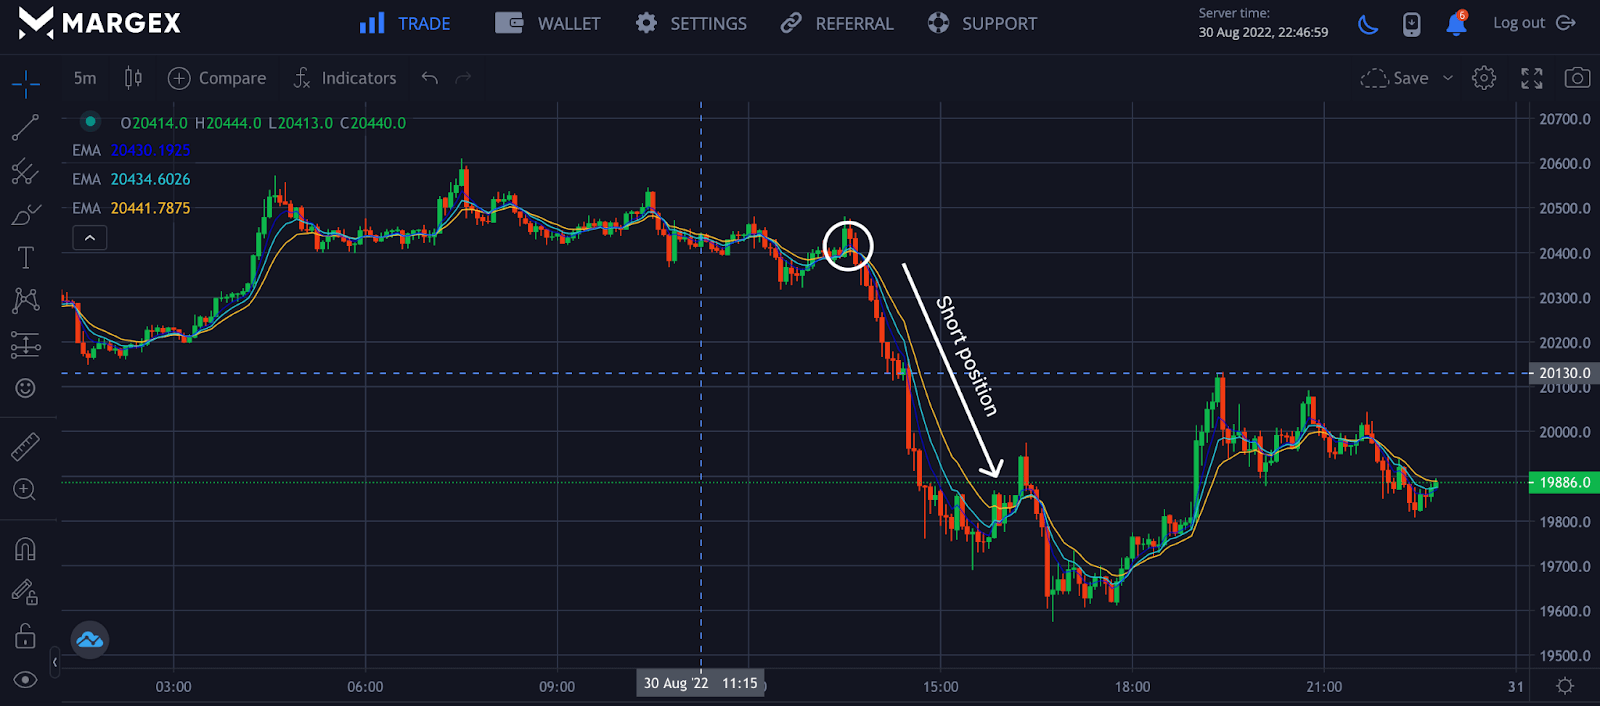
The moving averages in a downtrend for a short leverage position act as dynamic resistance holding price from reversal; on a successful break of resistance, this invalidates the trend structure signaling a change in trend is imminent, and the trader should close the open short position.
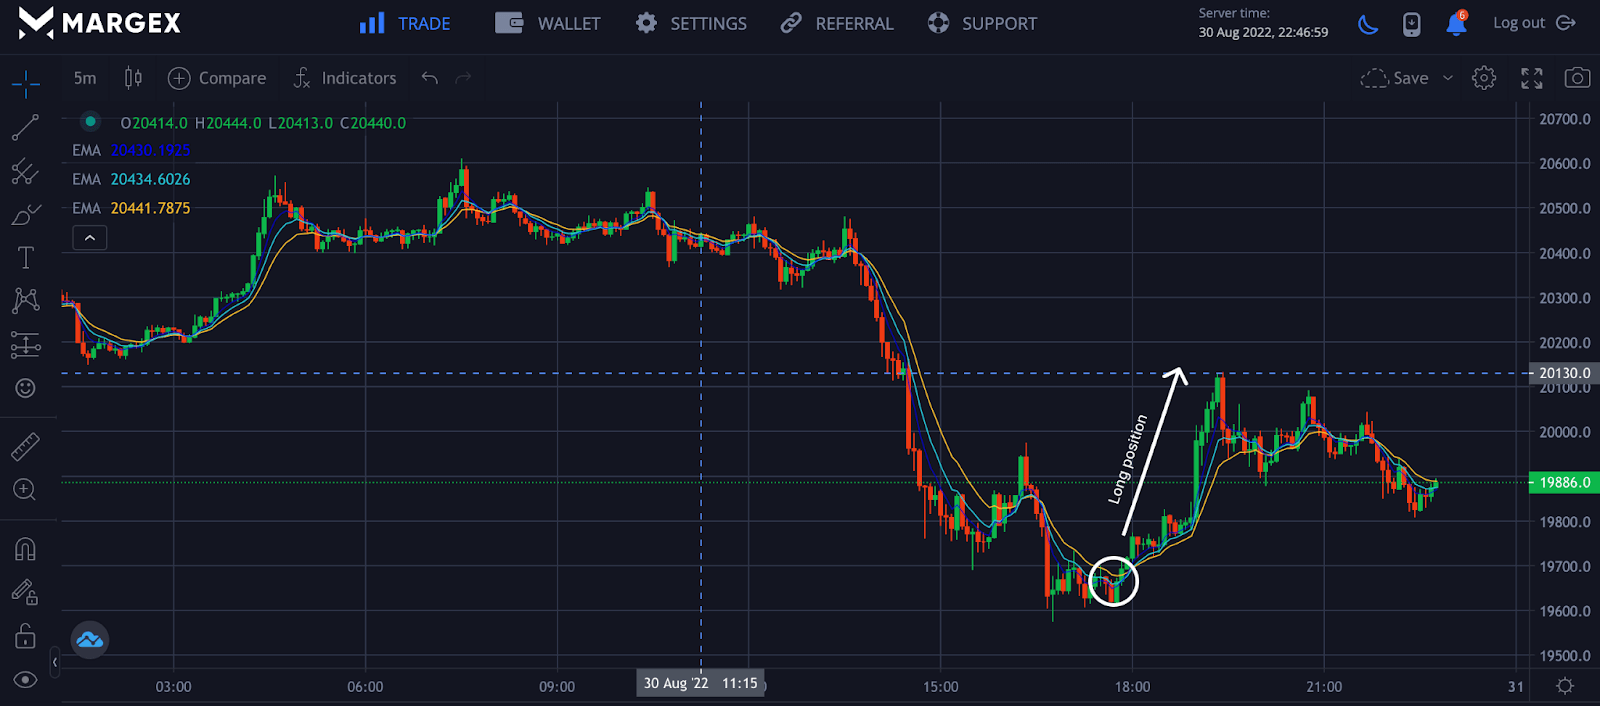
From the Image above, a successful crossover of the moving averages initiates an uptrend with two or more candles closing above the moving average. A trader can find a suitable entry for a long leverage position. In an uptrend, the moving averages serve as the dynamic support holding prices from going lower.
Swing Trading
Swing trading is strategy traders or investors employ to take advantage of small gains in short-term trends while minimizing losses and maximizing profits. The gains could look small but at a more consistent rate employing compounding power over some time.
Swing trading is held for a couple of days to weeks. This means riding trends over a long period. Most traders use moving averages of 50-day, 100-day, and 200-day (50-100-200) to trade these trends.
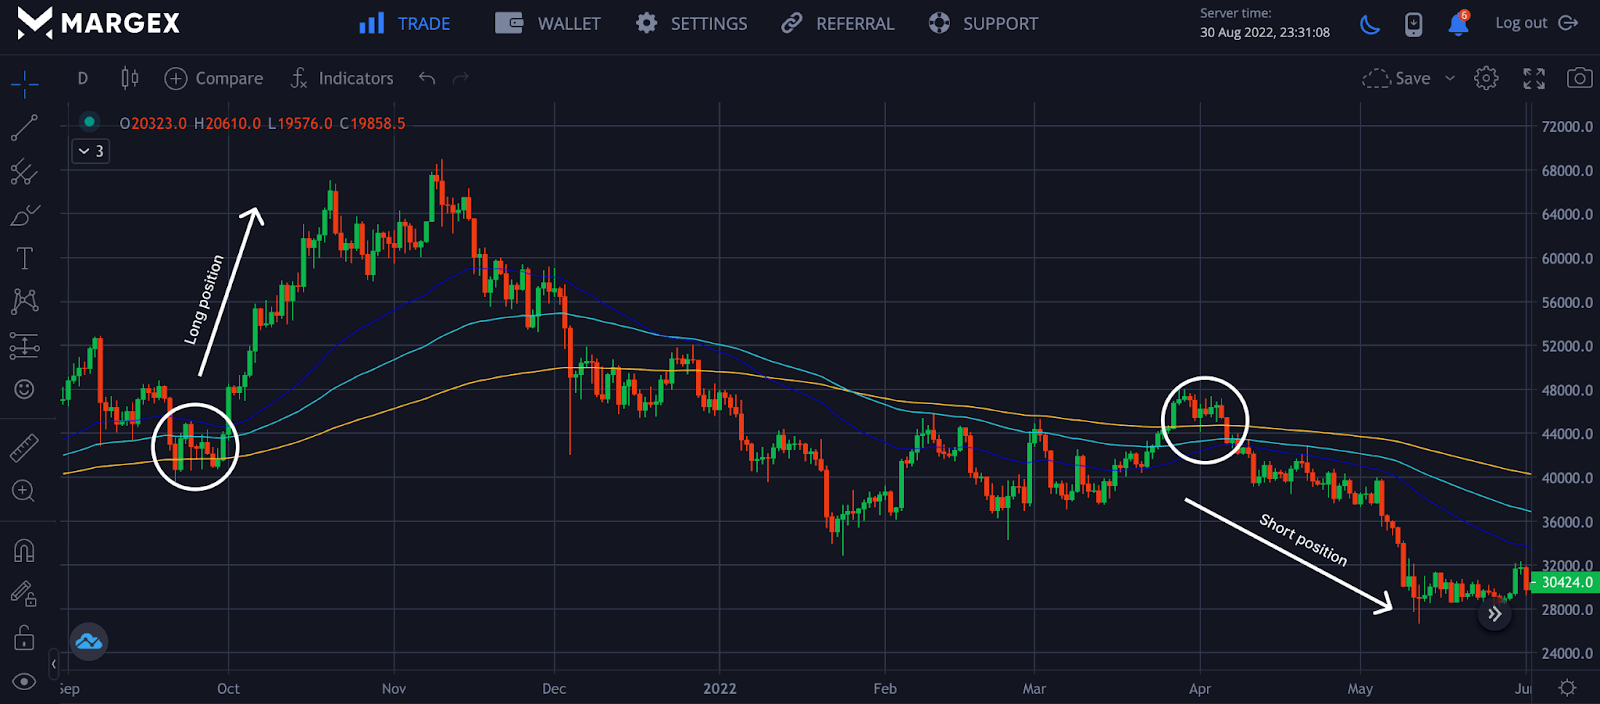
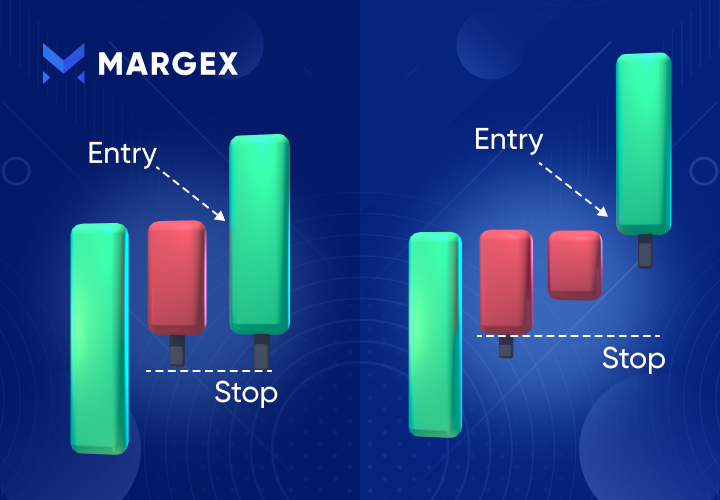
From the chart above, for a long position, the candles need to close the three moving averages after a crossover is confirmed before taking a long position using the daily timeframe.
For a short position to be activated, at least 2-3 candles need to close below the three moving averages of 50-day, 100-day, and 200-day for a short position to be initiated.
Trading moving averages alone is not advisable as they lag and are not extensively profitable. Combining moving averages with other trading strategies will give you more and better trading opportunities.
Moving Average (MA) Crypto Trading Strategies
Moving average is a common trading technique many traders employ for trading in the financial market, with cryptocurrency no exception to help smooth out price actions.
Moving averages as lagging indicators highlights the need to combine them with other trading strategies for optimal profitability.
Moving Average Crossover
Due to the market price actions, traders introduce moving averages to filter prices and forecast market trends. Mastering moving averages, traders can find potential entries from crossovers.
Moving average crossover is a strategy where a crossover happens between short-term or fast moving averages above or below the long-term or slow moving average. A moving average helps trades spot trend patterns in the market, and possible directions of the asset as the trends come to an end.
Trading moving average crossover is more than just timing entries and exits, as most traders see it; this simple indicator has created many names due to its movement. The golden cross is where the short-term moving average crosses above the long-term moving average, while the death cross occurs when the short-term moving average crosses below the long-term.
The financial market moves in trends, and as traders find out that moving averages help them to identify market trends, it is easier to combine with other proven strategies for reasonable risk management.
For a non-trending market such as ranges, the moving average strategies will be ineffective; using the moving average crossover would lead to losses.
How To Use The Moving Average Crossover?
Moving average crossover is one of the most straightforward strategies, with price crossover meaning prices closing above or below crossovers to signal entry or change in trend directions. This strategy focuses on the short moving average, making a cross over the long moving average either in an upward or downward direction.
For a buy signal, the short-term moving average must cross above the long-term moving average, with prices closing above the crossovers.
For a sell signal, the short-term moving average must cross below the long-term moving average, with prices closing below the crossovers.
Moving Average Double (DMEA)
This is an indicator like the normal, exponential moving average; just like the name implies, it is the double moving average used by technical traders to reduce the lag noise of prices due to price movements.
This indicator doubles the exponential moving averages while canceling the lag by removing the smoothed exponential moving average. Because of the complexity of this indicator and requires more calculations, long-term traders or swing traders use it to filter out price noises and reduce lags in price.
Dynamic Resistance and Support Trading Strategy
As a crypto trader, we know that you should be familiar with the conventional support and resistance used to keep prices from trending lower or higher. Dynamic support and resistance are quite different from regular support and resistance because they constantly change due to their changing price actions.
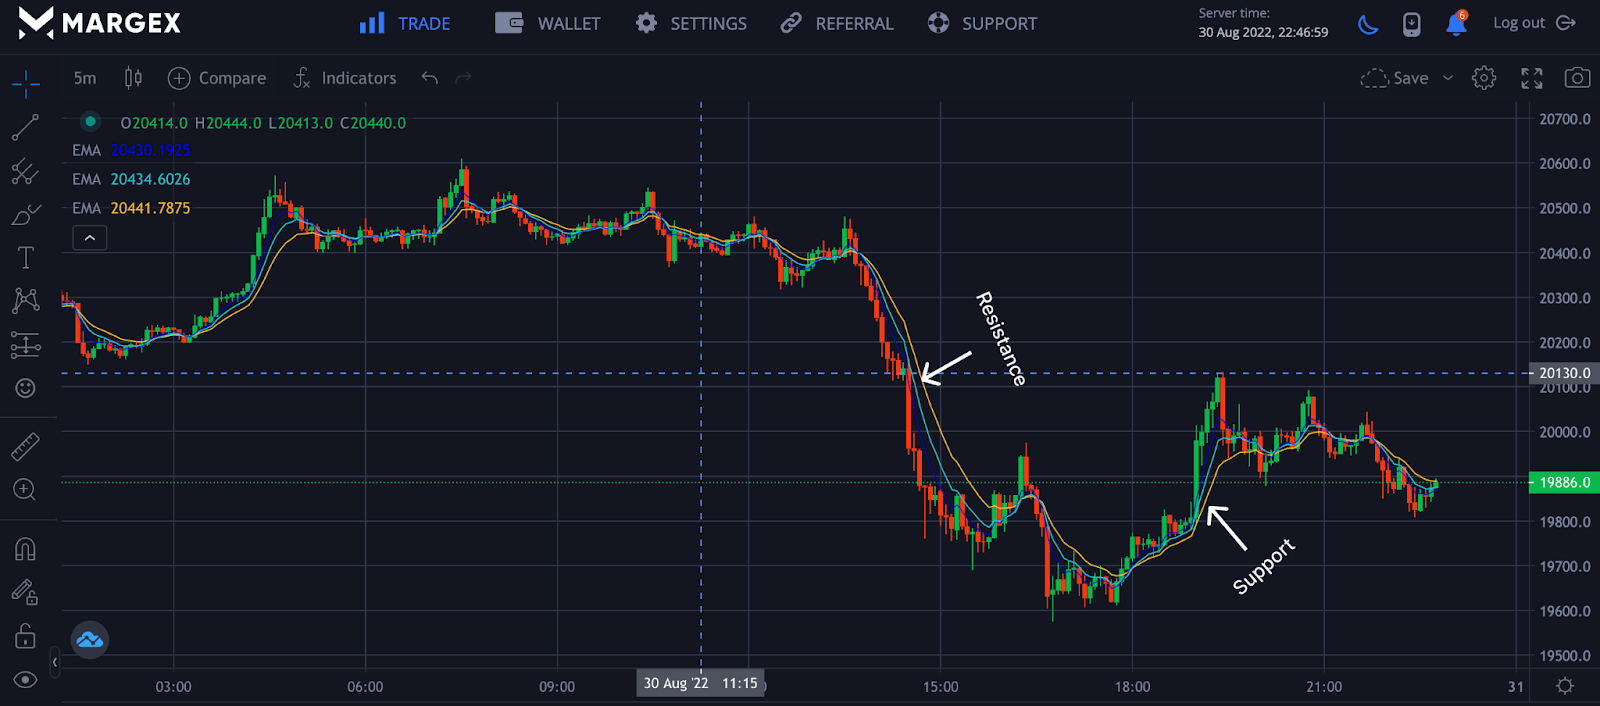
From the chart, when the price is above the moving averages, then the moving average acts as dynamic support for prices above, while when prices are below the moving averages, the moving averages act as resistance preventing prices from breaking above.
Triple Moving Average Crossover
The triple moving average crossover is a technical analysis technique to find profitable trade outcomes. This occurs when three moving averages of varying lengths cross over each other to the upside or downside of a trend.
Investors and traders always look for the most profitable strategy with the greatest profit potential. They investigate various strategies, ranging from chart patterns to indicators with moving averages. Triple moving average crossover is a highly profitable technical analysis tool used in trading to maximize uptrends while minimizing downtrends or downsides.
The Triple Moving Average Can Come In Two Forms
Tripple moving average can come in two forms the double exponential moving average (DEMA) and the triple exponential moving average (TEMA). They are both created to filter price lags due to price actions. These two triple averages differ in their formulas, which means they are both different in usage.
Multiple Moving Averages (Guppy MAs)
The Guppy multiple moving averages are a technical indicator that aims to react faster to potential breakouts in the price of a crypto asset. This was named after it was developed by Guppy, who used the exponential moving averages to capture prices. Considering how it reacts to price change, Guppy reiterates that GMMA is not a lagging indicator as it provides a warning ahead of price change.
Moving Average Hamming
Hamming moving average, also known as the weighted moving average, is used for weighting factors to price data on a function obtained from spectra analysis. Hamming moving averages respond better and faster to cyclical price actions by reducing erratic prices rather than traders' normal conventional moving averages.
Due to the complex nature of Hamming, moving averages developed and required good knowledge to use and implement into strategies. Most traders would rather learn the conventional ones.
Moving Average Envelopes and Bollinger Bands
Moving averages have become so popular among traders due to their simplicity; unfortunately, this indicator produces false signals in a ranging market and is prone to many losses. To help cut down those losses, there was a need to introduce envelopes to cut down price actions resulting in these irregularities. As time evolved, John Bollinger built on the ideas of the moving average envelope to design the Bollinger band adopted as a trading indicator for many traders.
The Bollinger band is a 20 simple moving average (SMA) technical analysis tool built for high profitability with simple and direct strategies.
The Bollinger band is made up of three components, namely, the upper band, lower band, and middle band.
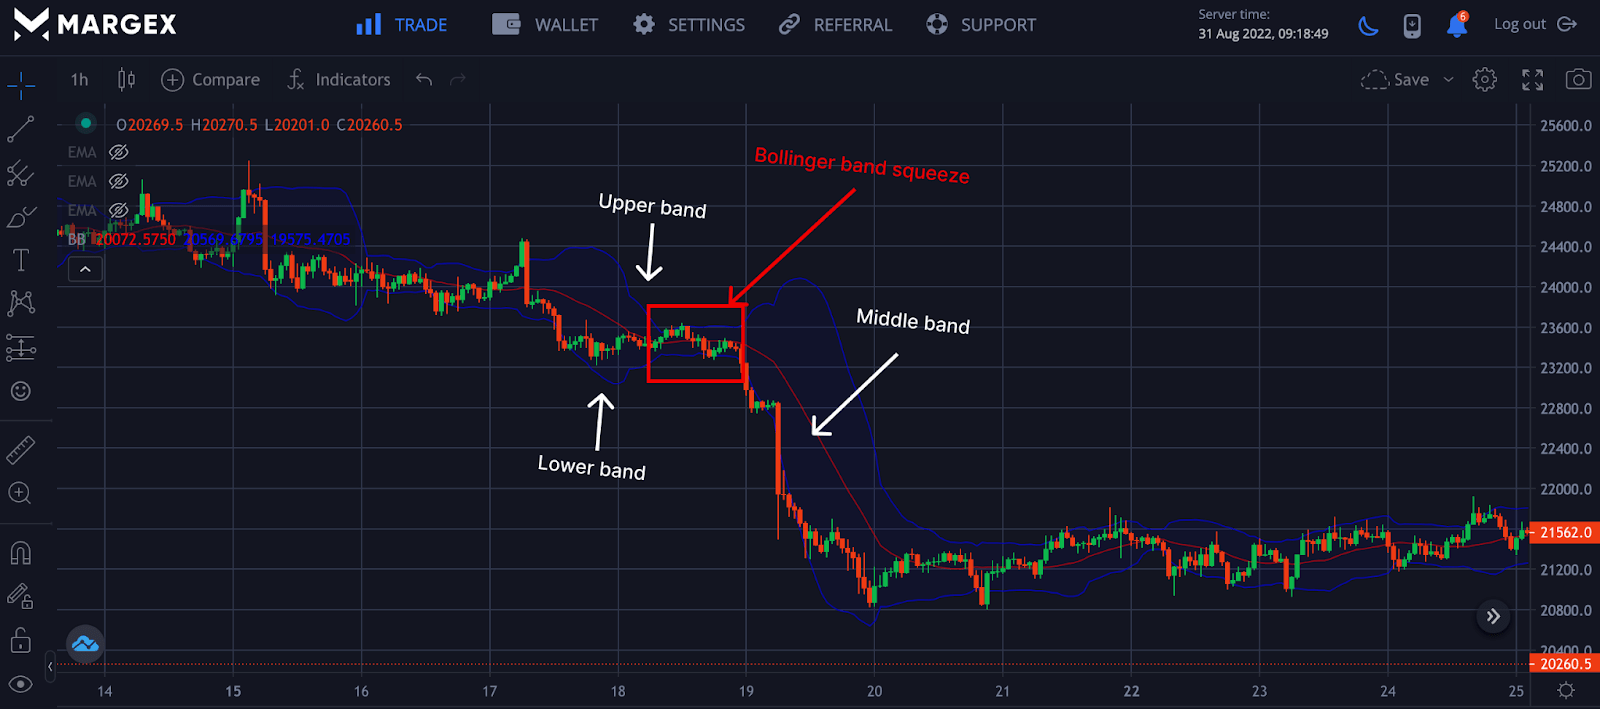
The middle band is the 20-moving average and acts as resistance and support depending on the location of the market trends and the close of candles.
In an uptrend, the middle band supports prices; a break and close below this band signify a change in the market trend.
While In a downtrend, the middle band acts as a resistance for prices, a break and close above this band signifies a change in the trend of the market.
Riding massive trends as a trader with the Bollinger band is what most traders explore; the Bollinger band has what we call the "Bollinger Squeeze," which signifies potential price volatility is about to occur either in an upward or downward trend.
Moving Average Channel
Moving average channel (MAC) is a technical analysis tool traders use to define specific stop-loss, setups, and triggers. This simple tool is based on the averages of lows and highs of the moving averages' closing prices. The moving average channel is not like the traditional moving averages, but the performance and results meet up to the expectations of this strategy.
How To Trade Using Moving Averages On Margex?
Margex, as a Bitcoin-based derivatives exchange, crypto traders can trade up to 100x leverage with various crypto assets.
The Margex exchange is known for its top-notch UI interface that makes trading easy even for beginners, with some of its inbuilt features tailored to help traders become more profitable.
In other to help traders and investors become more profitable, Margex offers unique staking while trading feature for traders and investors, which allows you to earn passive income despite how volatile trading can be. Daily rewards are paid instantly and added to your staking balance.
To access Margex to the full as a trader, you would need to log in to have access to these features and technical analysis tools, which are built with real-time prices to assist you in making money trading.
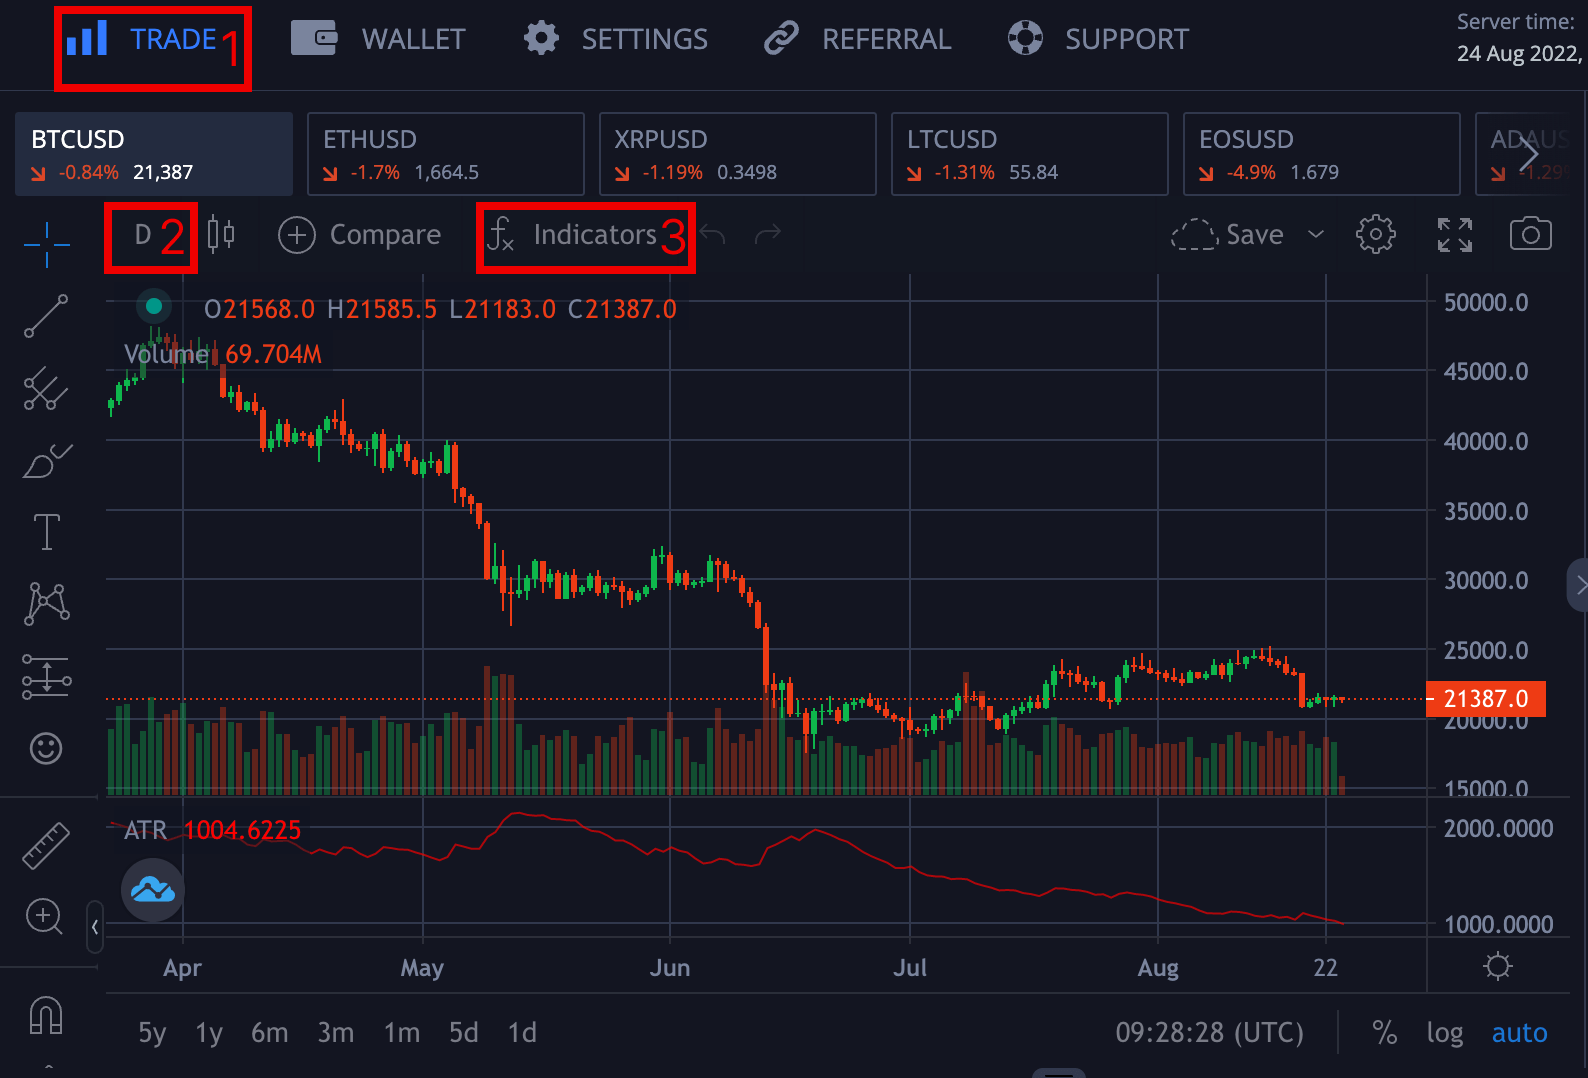
- Trade - To access technical analysis tools where you can seamlessly execute your trades, click on trade at the top labeled 1.
- Timeframe - Set the timeframe you want to trade based on your personality by clicking on the part labeled 2. Timeframes ranging from one minute to one month are available.
- Indicators - Traders can access all free indicators available on Margex by clicking Indicators and trading based on their strategies. This article focuses on how to set up the Exponential Moving Average and how to use it profitably. You can access all available indicators by clicking on the Indicator icon and then searching for moving average exponential.
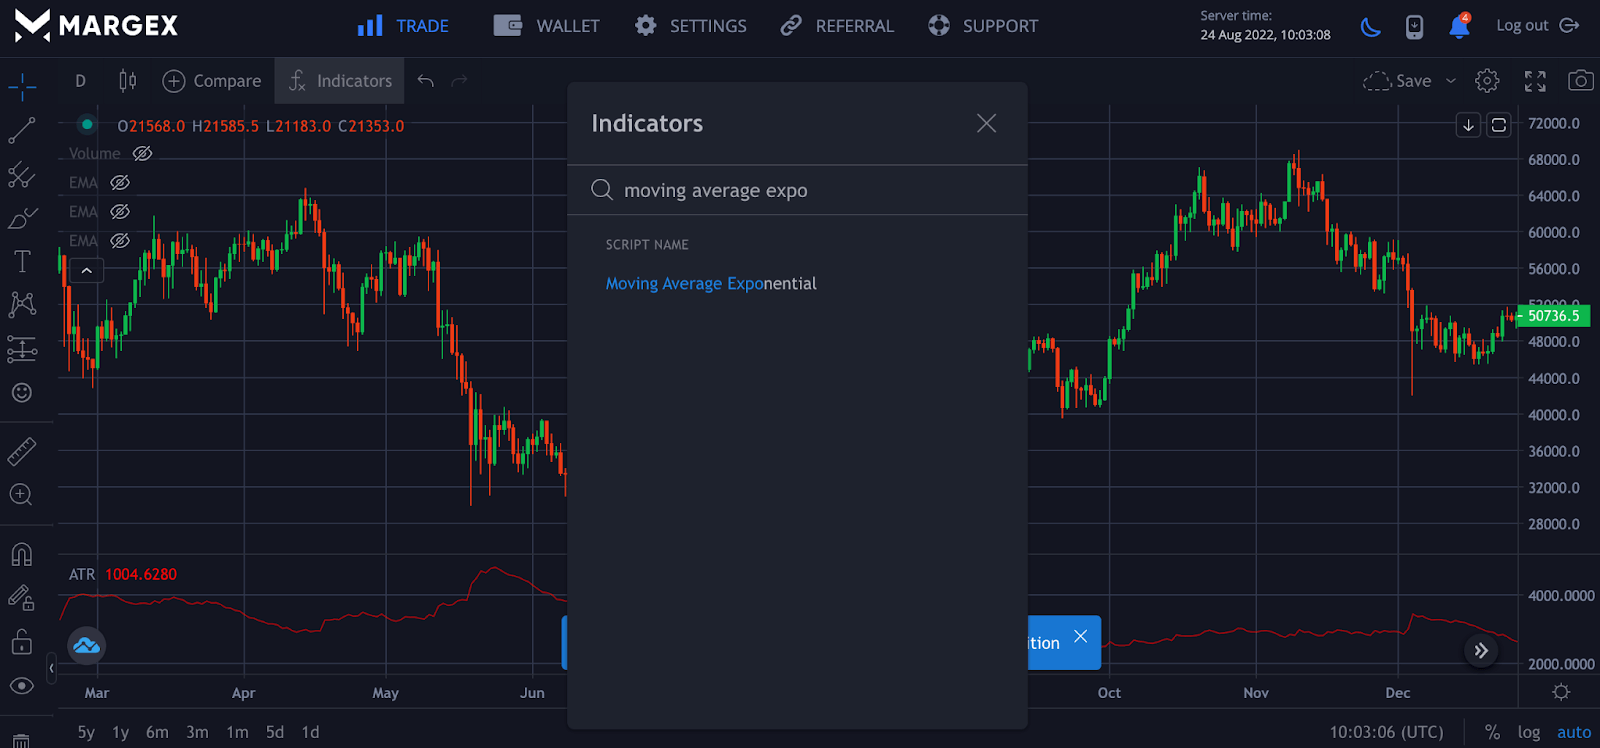
We need to click on this indicator tool three times because we are using the triple moving average, as the name implies. This will allow you to trade with the indicator. It is critical to note that the 9-day moving average is the default value for moving averages. You'd have to tweak the settings to suit your trading strategies.
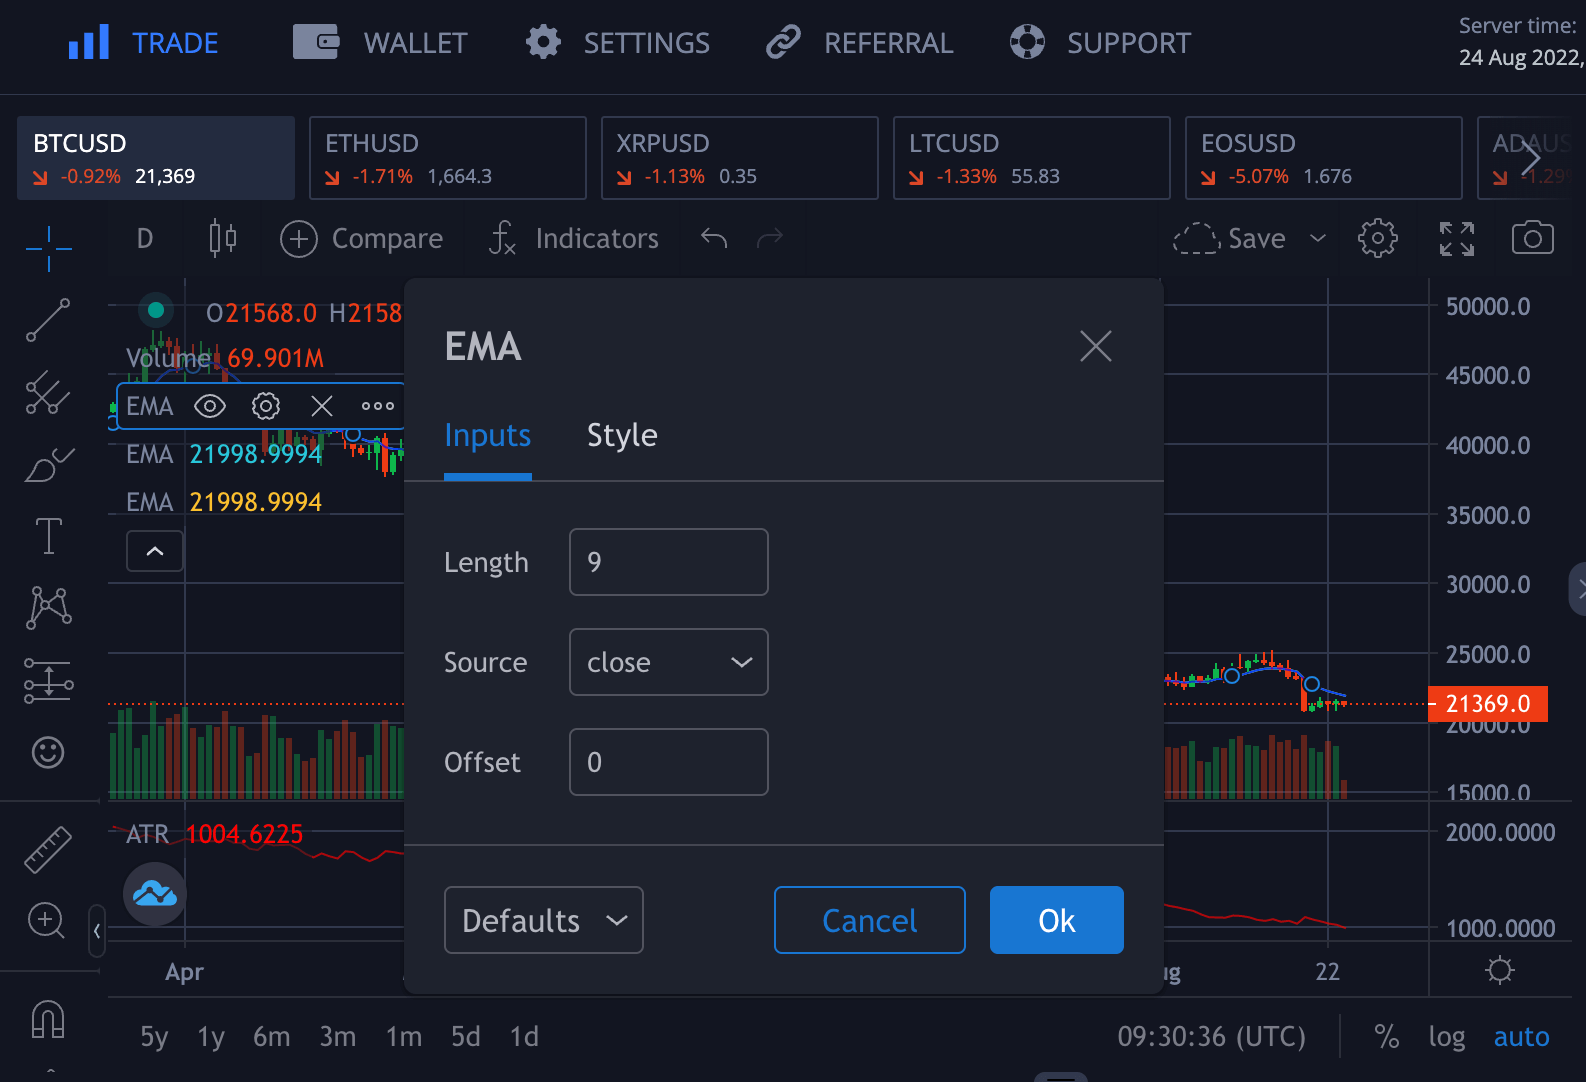
Hover over the EMA on the left side of the screen and click on the settings Icon to change the color style and adjust these moving averages from appearing as a single moving average. After you've made the necessary changes, you're ready to Go!
FAQ
There are many unanswered questions regarding moving averages and how to use them for trading. This part of the article focuses on those questions you wish to have answers to.
Do Moving Averages Work For Crypto?
Moving averages work for all financial markets, including crypto; for the best result applying moving averages to your trades, you need to combine this indicator with other strategies you have backtested and proven to have worked over time.
Which Is The Most Accurate Moving Average?
There is no best or most accurate moving average as different traders have their preferences and strategies for applying this indicator. Whatever produces the best result and return on investment (ROI) is the best strategy for a trader.
Which Indicator Is Best For Crypto?
Due to the volatility of the market and price actions, there is no best indicator for all trades. Different indicators serve different purposes; as a trader, you must determine the best indicator for a particular market trend as prices move in.
Should I Use MA Or EMA?
They are both used for price actions and volatility but work best in a trending market, not in a ranging market. On the other hand, exponential Moving Average (EMA) produces more accuracy when it filters volatility due to price actions.
Which EMA Is Best For 15min Chart?
Trading the 15mins chart means you want to scalp and take advantage of slight price movement. This produces better results for advanced traders but is not advisable for beginners as this involves so many price actions. There is no best EMA for 15mins charts, but 5-day, 8-day, and 13-day EMA has been proven to have worked severally.
Which EMA Is Best For 1-Hour Chart?
Most traders used the 8-day, 13-day, and 21-day EMA because it has proven more successful, but traders differ in personality. It would be an idea to research, backtest strategies, and decide what works best for you.