Many traders dream of being able to generate highly profitable trades on a consistent basis to earn regular income from trading. While some people think that trading is hard, the dream is not as unattainable as what they imagine it to be. Our chart patterns cheat sheet can instantly turn you into a trading guru. Read on to find out what the most useful chart patterns are and see some examples of how they look in real life and learn how to trade them.
Before that, we have put together a table of the top 20 useful chat patterns you can print out and paste on your desk as a quick reminder to help you identify trade setups as quickly as they appear.

Chart Patterns Cheat Sheet
There are 3 three types of patterns: continuation, reversal, and bilateral.
Continuation patterns indicate that the current trend is likely to continue. Examples of continuation patterns include flags, pennants, and rectangles.
Reversal patterns indicate that the current trend is likely to reverse. Examples of reversal patterns include double tops and bottoms, head and shoulders, and triangles.
Bilateral patterns indicate that the price could move in either direction. Examples of bilateral patterns include wedges and channels.
Examples of Reversal Patterns From The Chart Patterns Cheat Sheet
The Margex trading platform provides useful technical analysis tools to help traders identify useful chart patterns to help them become successful traders without breaking a sweat. You can find all the patterns in our chart patterns cheat sheet on the Margex platform. Our chart samples below are of recent price movements of BTC extracted from the Margex platform.
Now, let us take a look at some examples of the most commonly seen trend reversal patterns on our chart patterns cheat sheet and explain how to spot and trade them.

Bullish
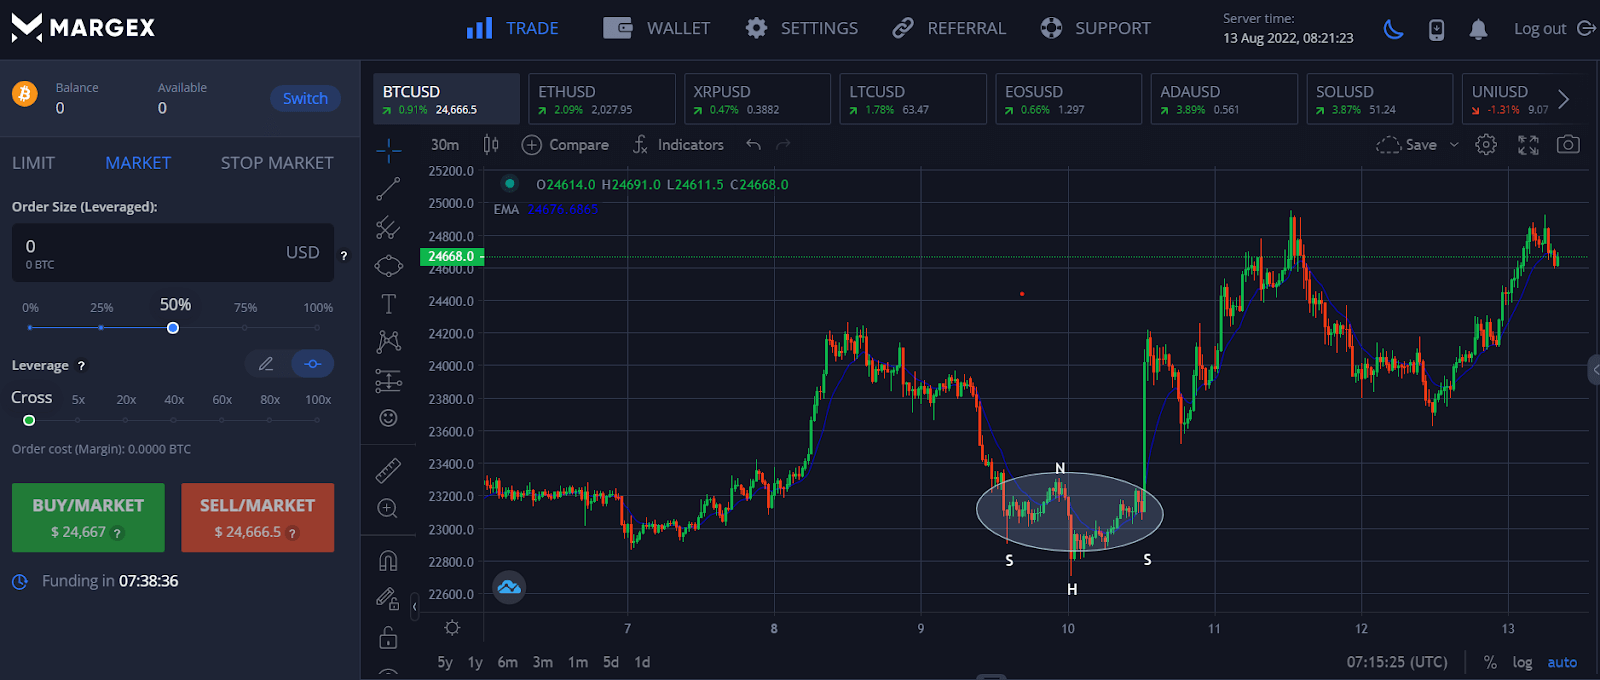
BTC Inverted Head and Shoulders Chart Pattern August 2022
On 10 August 2022, after declining for about 2 days, the price of BTC made an inverted head and shoulders chart pattern on the 30-min chart. The two S in the diagram depict both left and right shoulder while H represents the head, i.e. the lowest valley.
Price jumped very swiftly upon breakout of the neckline, which is located at the prior high before the formation of the “head” as indicated at point N, as many traders will rush in to trade an inverted head and shoulders pattern due to its high probability of success, which quickly propelled the price of BTC higher to hit its profit target of $24,000, which is the vertical distance between the lowest valley to its immediate resistance at point N.

Bearish
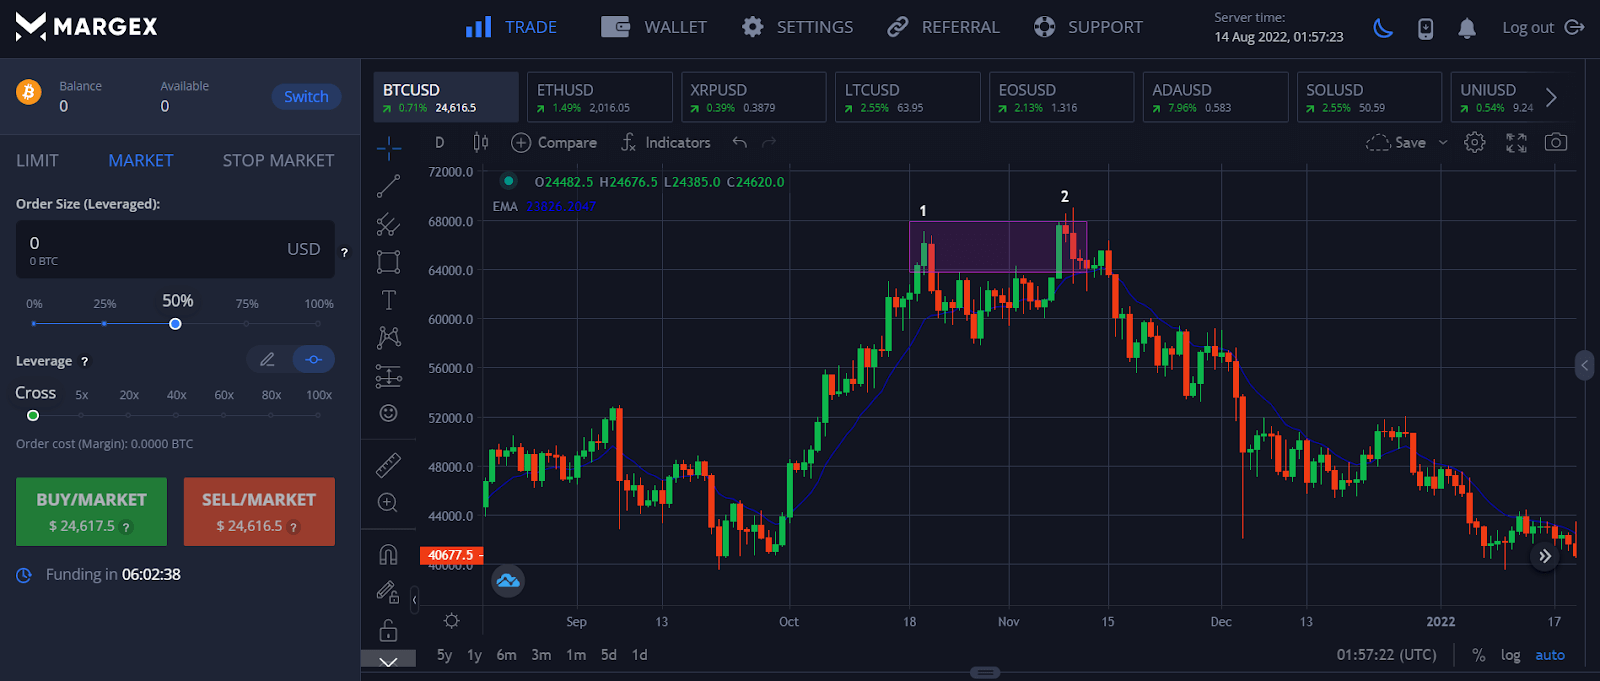
BTC Double Top Chart Pattern November 2021
On 9 November 2021, the crypto bull market rally reversed after BTC formed a double top chart pattern on the daily chart, printing two distinct peaks at around $68,000. After the formation of the second top, the price of BTC began moving in the opposite direction – from the previous uptrend, price has reversed into a downtrend. Typically, technical charts are able to foretell macro events as can be seen in this example, not long after the double top, fundamental analysts began to warn about how the US hiking interest rates would negatively impact the price of BTC due to it being quoted in USD. In that sense, a technical analyst who knows how to read charts may have an upper hand over investors who only use fundamental analysis when it comes to market timing and spotting trend reversals. Indeed, over the course of the following months in our example, the price of BTC started forming lower highs and lower lows and began a long 7-month downtrend.

Examples of Continuation Patterns From The Chart Patterns Cheat Sheet
After seeing examples of reversal patterns, it is time to take a look at some examples of the most commonly seen trend continuation patterns on our chart patterns cheat sheet and explain how to spot and trade them.
Bullish
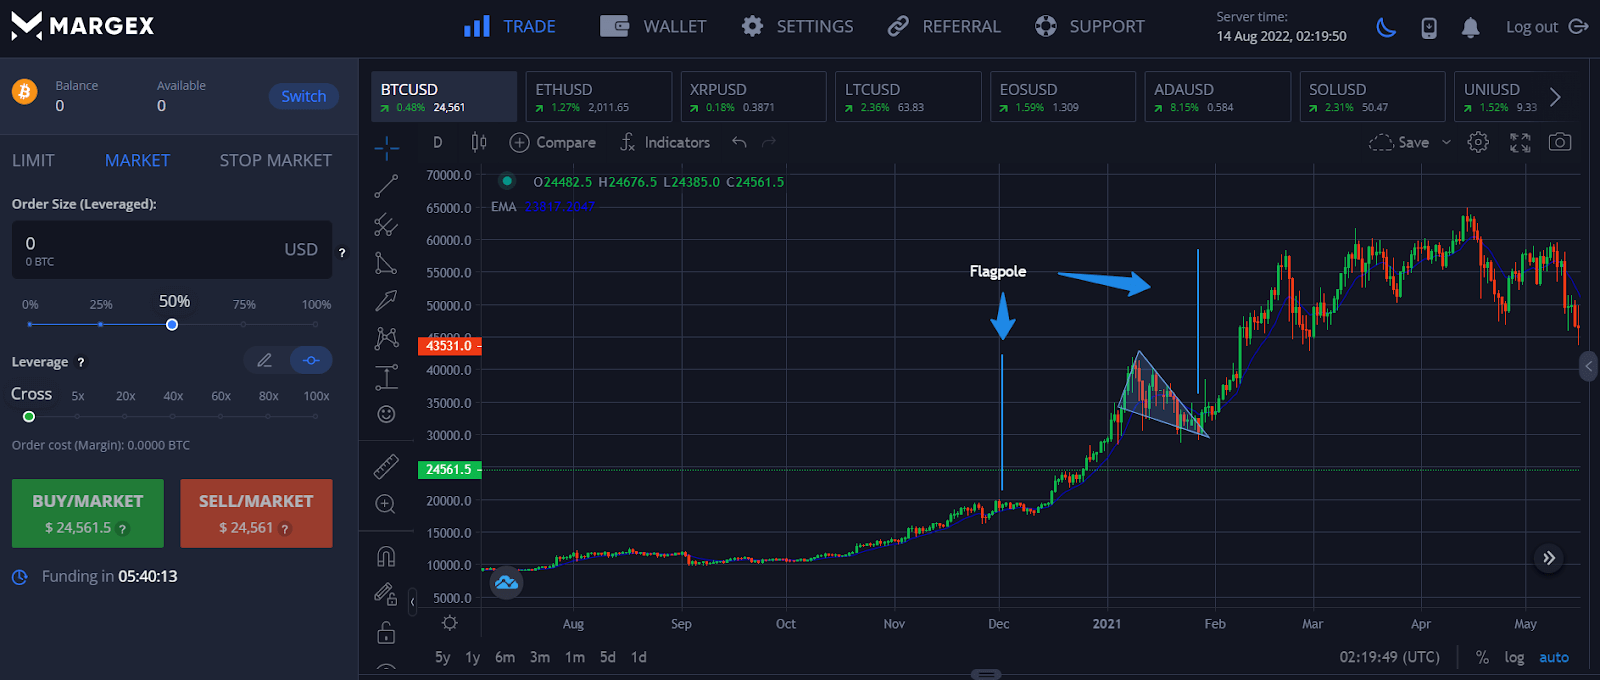
BTC Bullish Pennant Chart Pattern December 2020 – February 2021
At the beginning of the 2021 bull market, the price of BTC made a bullish pennant chart pattern as shown in the diagram below. The initial spike took about a month to complete, while price action converged and coiled to a point before finally breaking out in the direction of the previous bull trend. This initial spike is commonly referred to as the flagpole.
The magnitude of the subsequent rise was similar to the initial spike of $22,000. Where the initial spike took the price of BTC from $20,000 to $42,000, the pennant breakout continued to add another $22,000 to the price of BTC, bringing it from $35,000 to $57,000, which was the exact vertical distance of the initial price spike, showing how traders will be able to know where to set the price to take profit when trading such a chart pattern.

Bearish
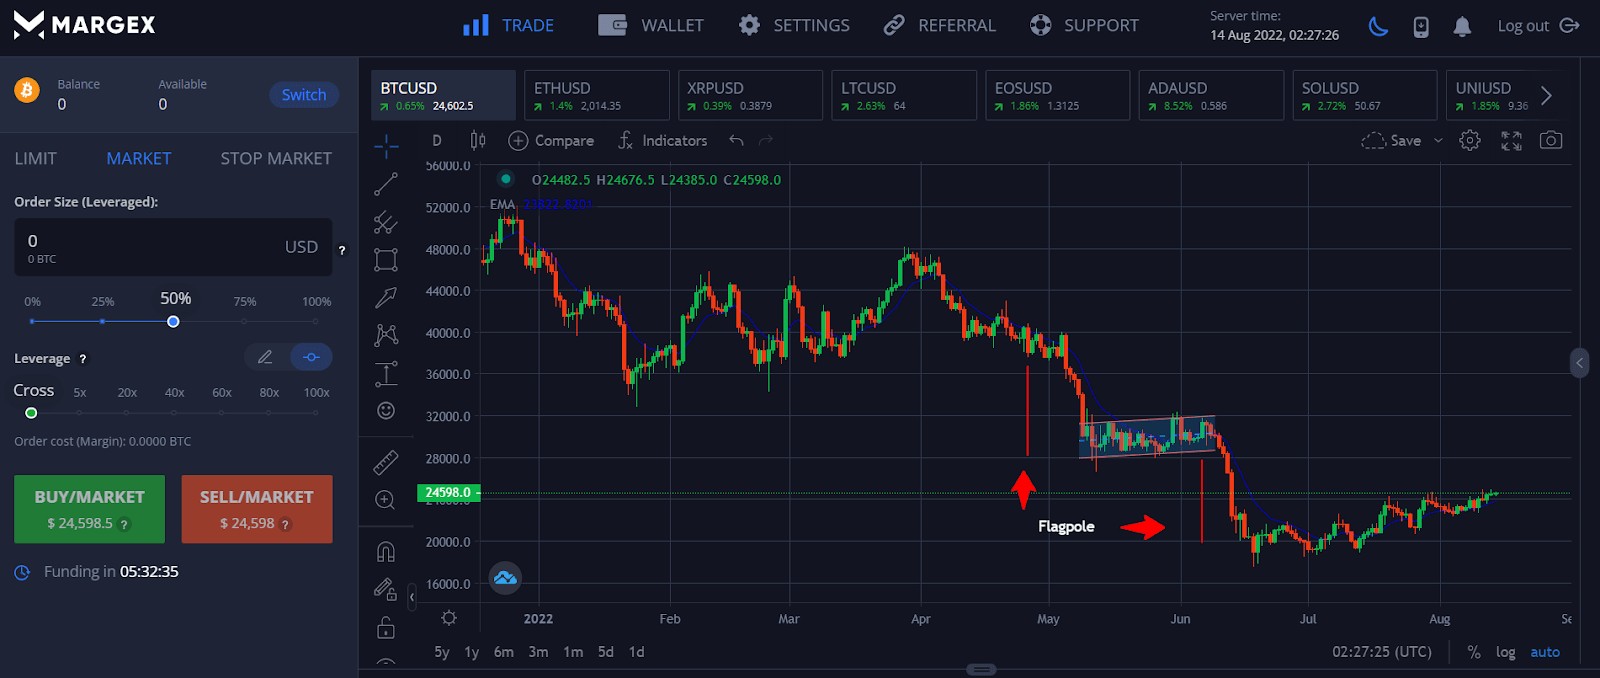
BTC Bear Flag Chart Pattern May 2022 – June 2022
BTC formed a bear flag chart pattern in May 2022. After price initially broke its support at $37,000, price fell sharply to $28,000, forming a flagpole before consolidating within a tight range between two parallel lines, after which it “broke out” into the second sharp fall. The measuring objective of a flag is the same as that of a pennant, that is, the equi-distance of the flagpole of the preceding sharp move. In this case, the vertical distance of the almost straight line decline was around $9,000, which would give a price target of around $19,000, which was fulfilled within days.

Here you can find more detailed information about trading patterns:
- ABCD Pattern
- Wolfe Waves Pattern
- Harmonic Bat Pattern
- Butterfly Chart Pattern
- Gartley Pattern
- Shark Pattern
- Tweezer Top Chart Pattern
- Inverse Head And Shoulders Pattern
- Evening Star Pattern
- Rounding Bottom Pattern
- Triple Bottom Chart Pattern
- Crab Pattern
- Cup and handle pattern
- Diamond chart pattern
- Triple top pattern
- H pattern
- Wyckoff Chart Patterns
- Rising Wedge Pattern
- Reversal Candlestick Pattern
- Marubozu Candle
- Hanging Man Candlestick Pattern
- Cypher Chart Pattern
- Abandoned Baby Candlestick Pattern
- Bull flag
- Bullish Harami Candlestick Pattern
FAQ
Now that we have seen the chart patterns cheat sheet and gone through some real life examples, let us discuss more by answering some common questions about our chart patterns cheat sheet posed by traders
What Are The Most Profitable Chart Patterns On The Chart Patterns Cheat Sheet?
While all chart patterns are profitable and it is difficult to pinpoint which are more profitable than others, typically, a reversal pattern may yield a higher long-term profitability for the patient trader, since its appearance marks the reversal of an old trend, which also implies it is the start of a new trend. A new trend could have more room to grow, as opposed to a trend continuation pattern, which occurs in the middle of an existing trend and may have less room to grow further. That said, the profitability of a chart pattern is more accurately determined by how far away the price target is and how much a potential move could bring, rather than determining it based on the type of chart pattern.
How Do You Find The Pattern Of a Chart?
One can find the pattern of a chart by looking at the price action of the asset in question. Anyone can go to the Margex platform to sign up for a free account to use their free technical analysis software to find chart patterns.
What Are The Different Graph Patterns On The Chart Patterns Cheat Sheet?
Graph or chart patterns come in various shapes and sizes and are normally classified into reversal, continuation, and ranging patterns. Reversal patterns mark the end of an old trend and the beginning of a new trend, while continuation patterns confirm the continuation of an existing trend and usually occur in the middle of a strong trend. Ranging patterns on the other hand, tells you that the price of the asset is stuck within a trading range without going any particular direction. Please refer to our chart patterns cheat sheet above to find out more about the different chart patterns, how to spot them, and what they mean.
Are Chart Patterns Useful?
Yes, chart patterns are very useful to a trader that knows how to spot and trade them. Being able to identify chart patterns can help a trader spot and close out a wrong trade early, and more importantly, allow a trader to enter high probability trades at the best possible time so as to maximize his profits. A trader can use the associated measuring objectives with each chart pattern to set his price target.
What Time Frame is Best For Charts Patterns?
There is no hard and fast rule as to which time frame is the best for chart patterns, nor is there any chart pattern that is more suited for a particular time frame. The time frame of the chart you use should depend on your holding period instead of the chart type. A higher time frame chart is typically used for longer-term holding periods, while a lower time frame chart is used more for short-term trades. For instance, a swing trader that holds a trade for up to a few days may prefer using a 30-min chart to spot chart patterns, while a long-term investor may prefer to use a daily chart to see chart patterns that play out over a longer duration and may have a larger price objective. Please refer to our examples above to see the average duration it takes for chart patterns to play out on higher and lower time frames.
What is The Most Bullish Chart Pattern On The Chart Patterns Cheat Sheet?
All the bullish chart patterns are somewhat the same in terms of bullishness. To determine how bullish a chart pattern is, instead of focusing on the chart pattern itself, a trader should check for whether there are any overhead resistance levels above the bullish chart pattern to predict the chances of the eventual breakout from sustaining, or if the breakout can even materialize or not. If there are a lot of resistances above, a trader may decide not to take the trade as many other traders may sell at each resistance and obstruct the chart pattern from playing out. If there is no overhead resistance, then the chance of the bullish chart pattern playing out successfully is high.
Those things said, most experts do seem to concur that the inverted head and shoulders, being a trend reversal pattern where the buyers of the final dip do not even want to wait for the price to hit a double bottom, but are instead buying at a higher low, to be the most bullish chart pattern among our chart patterns cheat sheet.


