Trading in the financial market comes with many challenges. To make this easier, many traders and investors seek to build better and more robust trading strategies to help them remain profitable long-term while staying ahead of the market.
The crypto industry is identified to move in trends, and as such, the use of technical analysis strategies such as chart patterns, indicators, and oscillators are all used to identify the next trend reversals or open a trade for an early trend for optimum gains.
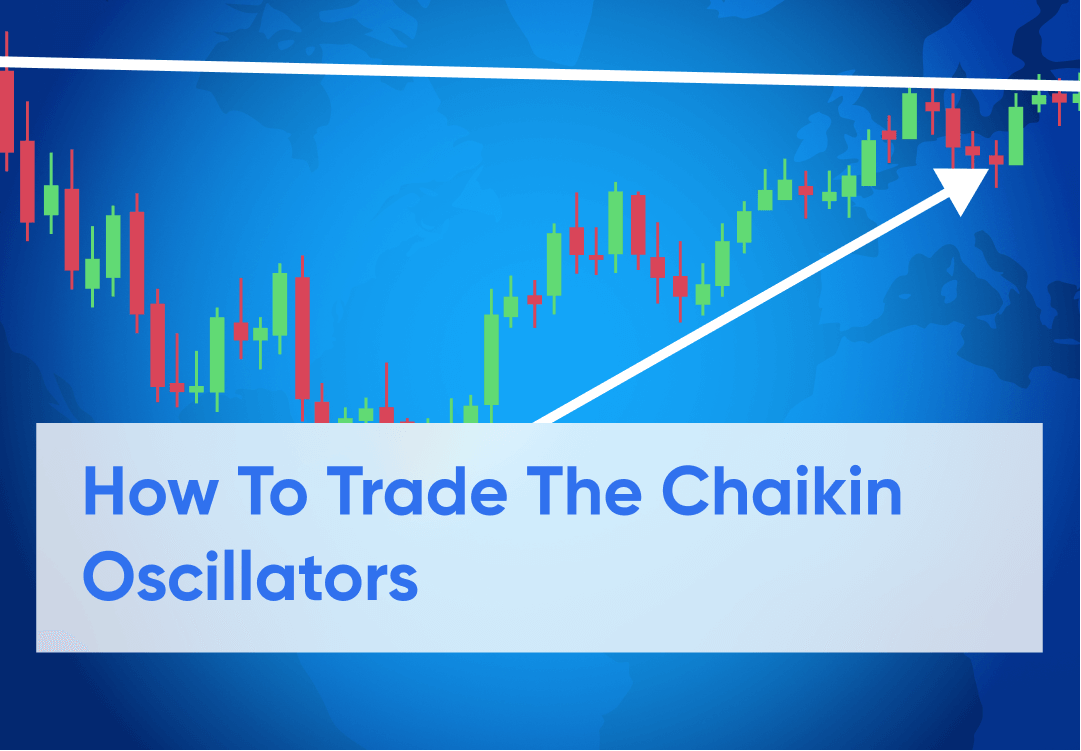
We have a deep dive into how to use the Chaikin oscillator, a better understanding, and how traders use this technical analysis tool to spot trend reversals, initial trend setup, and a good comparison with other indicators.
What Is The Chaikin Oscillator And How Does It Work?
The Chaikin Oscillator is, also known as the Chaikin Indicator used by technical analysts to analyze the price trends of different crypto assets based on the trading volume of the assets.
Charts represent this volume accumulation indicator; a divergence with the indicator concerning the price trends indicates that traders are skeptical about the current price of the crypto assets and believe a trend reversal would be imminent.
The Chaikin oscillator was produced in 1970 by Marc Chaikin, a well-known American trader; the Chaiken oscillator tends to confirm price trends and warn traders and investors trading a particular crypto asset of an intending price reversal either to a downtrend or uptrend.
The Chaikin oscillator is similar to the accumulation distribution line (ADL) calculated by subtracting the 10-day exponential moving average from the 3-day period exponential moving average.
The Chaikin oscillator is also a momentum indicator or volume accumulation indicator that gives traders an incite as regards the strength of the market as buyers and sellers participate in the crypto market.
The Chaikin oscillator indicator is seen as more of an accumulation distribution line than a price action indicator, as it shows both the strength of price movement and the volume of activity involved in buying and selling crypto assets over a period.
The Chaikin indicator is divided into two sections as regards the pressure of buying and selling. The reading of the Chaikin oscillator indicator above the zero line indicates buying pressure, while the reading of the Chaikin indicator below the zero line indicates selling pressure. The divergence between the indicator and price movement is the most common signal, as it flags market point reversals or trend reversals.
Example Of Chaikin Oscillator
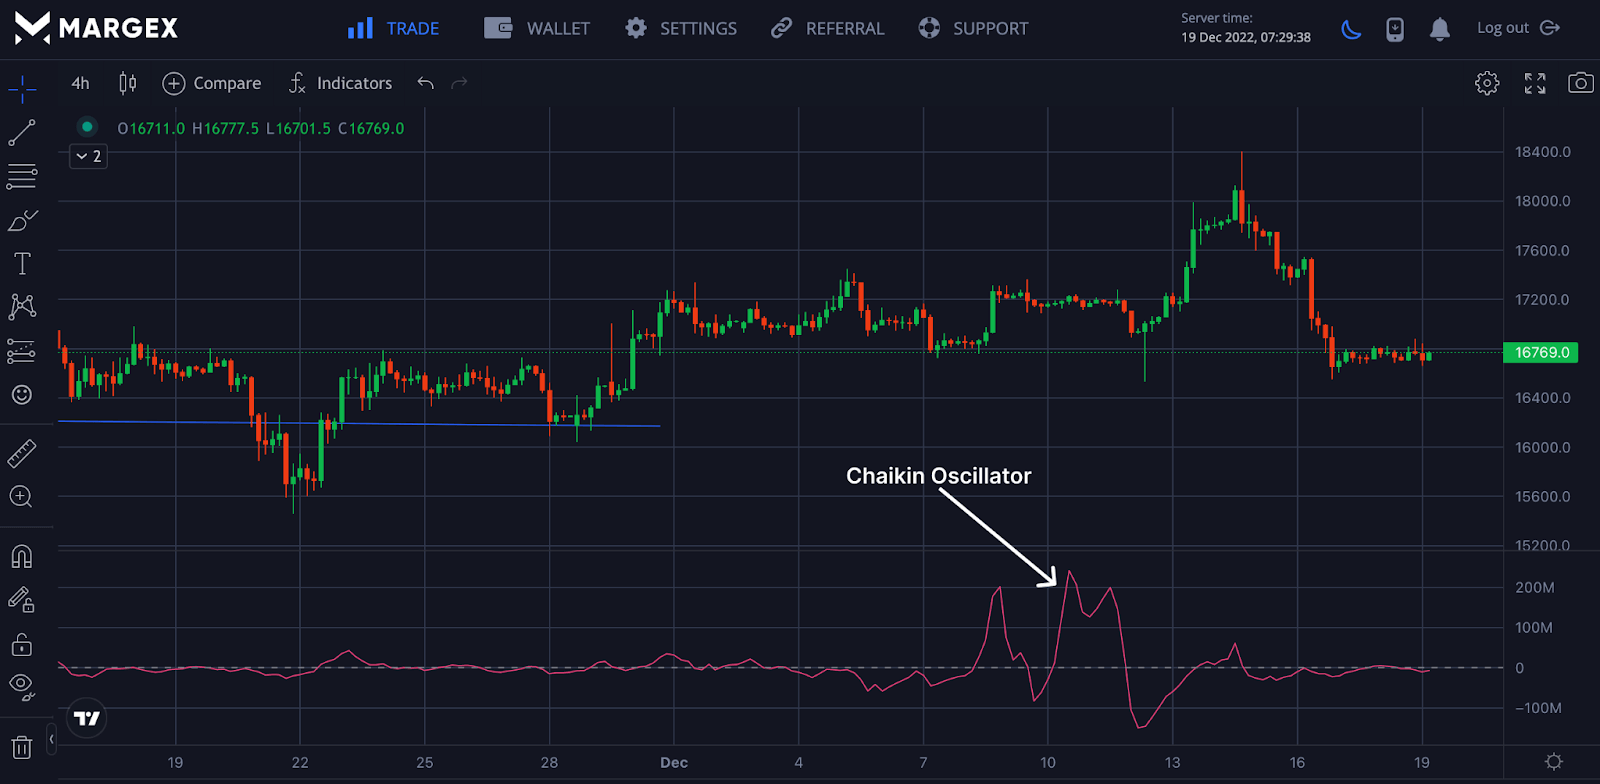
The image above shows the Chaikin volume indicator as it shows the buying and selling pressure volume. In a ranging market, the Chaikin oscillator tends to be flat with little or no volume but shows increased price movement as more buying or selling activities kicks in.
A crossover above the zero line indicates a bullish price change as more buying pressure is in place, as this was confirmed with more upward price movement. A crossover below the zero line indicates less buying pressure with more selling pressure.
What Does The Chaikin Indicator (CO) Indicator Tell Traders?
The Chaikin oscillator was birthed by Marc Chaikin, a famous trader that sought to compare volume and price levels for financial assets. The Chaikin oscillator is used by many traders to indicate when the crypto asset is overbought, oversold, trend reversals, buying pressure, and selling pressure.
A trader generates the Chaikin oscillator by first considering the accumulation-distribution line for a crypto asset by comparing the open, close, high, and low prices.
The Chaikin oscillator comprises the Moving Average Convergence Divergence (MACD) and the accumulation distribution line indicator. The accumulation distribution line indicator is achieved by comparing an asset's close location value (CLV) with the asset's high, low, opening, and closing prices are compared.
The Chaikin oscillator gives traders a better perspective on trading and making more and improved trading judgments, giving better profitability and improving the risk-to-reward ratio.
It is ideal to trade the Chaikin Indicator and other indicators as this gives better win rate trading the Chaikin oscillator in isolation wouldn't prove too profitable considering how volatile the crypto market is.
How To Calculate Chaikin Volume Indicator?
The Chaikin Oscillator is calculated by considering the following; money flow multiplier, money flow volume, and the total money flow volume to arrive at the accumulation distribution line (ADL).
To arrive at the Chaikin oscillator, we will find the money flow multiplier, multiply the money flow multiplier by volume, and find the total money flow volume.
Find the money flow multiplier
Money Flow Multiplier = [(Close – Low) – (High – Close)] /(High – Low)
Calculate money flow
Money Flow Volume = Money Flow Multiplier x Volume for the period
Determine ADL
ADL = Previous ADL + Current Period’s Money Flow Volume
Chaikin Oscillator = (3-period EMA of ADL) – (10-period EMA of ADL)
As a trader, you do not need to calculate all of these manually, as this could be tedious, but you can use the Chaikin oscillator.
Pros And Cons Of Chaikin Oscillator Indicator
Virtually all indicators have good and bad sides, as this market tends to expose them to extremely high volatility. Let us consider the pros and cons of using the Chaikin indicator.
Pros
- Use by traders to track price change and monitor the buying and selling pressure of traders or market activities
- Easy to use with good technical analysis of the market
Cons
- The Chaikin indicator is not ideal for novice traders who do not have proper knowledge of technical tools like the Chaikin oscillator
- Chaikin Indicator can produce false signals in an extreme volatile or ranging market, so it is best to trade the Chaikin oscillator with other indicators
How To Use The Chaikin Oscillator In Trading? (Step-By-Step Guide With Screenshots From Margex)
Margex is a Bitcoin-based derivatives exchange that allows traders to trade with up to 100X leverage size and simultaneously stake their leveraged tokens to earn up to 13% APY return on their investment.
Margex possesses unique staking features that allow both experienced and novice traders to earn in this current bear market, making trading crypto assets even tougher for traders and investors.
Margex platform has proved to be a trusted exchange amidst the present market conditions; with the help of Margex MP protection, traders and investors are guided from the frequent pumps and dumps in most trading platforms.
Because of the Margex user interface, it is easy for a trader to trade with just a few clicks and apply technical analysis tools to trade for better gains. Let’s see how to trade and apply the Chikin Oscillator on your trade using the Margex platform.
Step 1: Open An Account Or Login

The first step to accessing all of Margex tools, staking features, and Chaikin oscillator, as discussed, is to own an account with Margex, as this will boost your trading, and you can use Margex tools freely.
Step 2: Deposit To Enable Trading
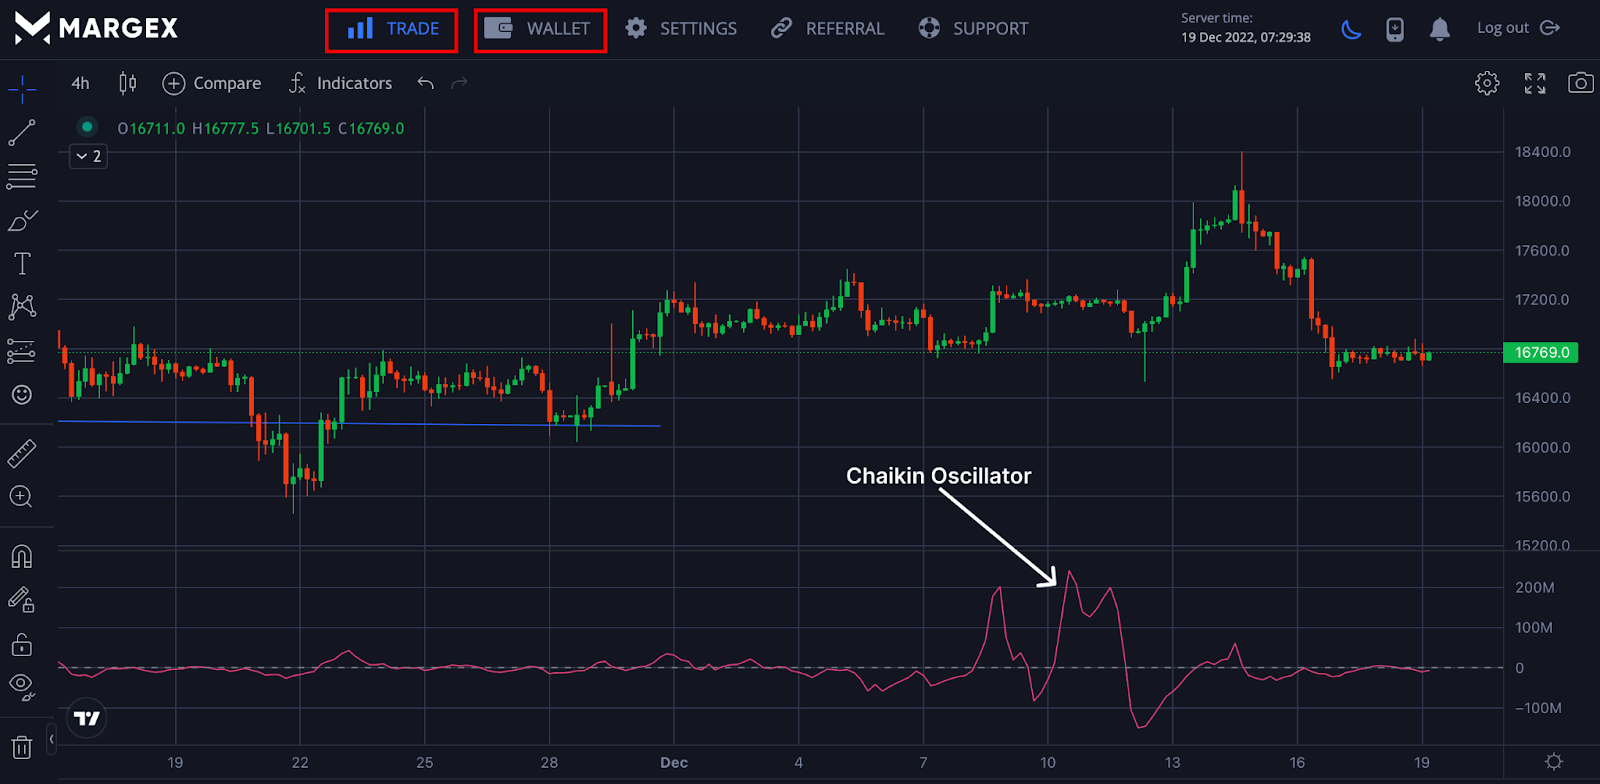
Depositing on Margex allows traders to access and practice all trading strategies. Clicking on the wallet button at the top allows you to make a deposit. Click on the trade section to enable the application of the Chaikin oscillator.
Step 3: Appy Chaikin Oscillator To Trade
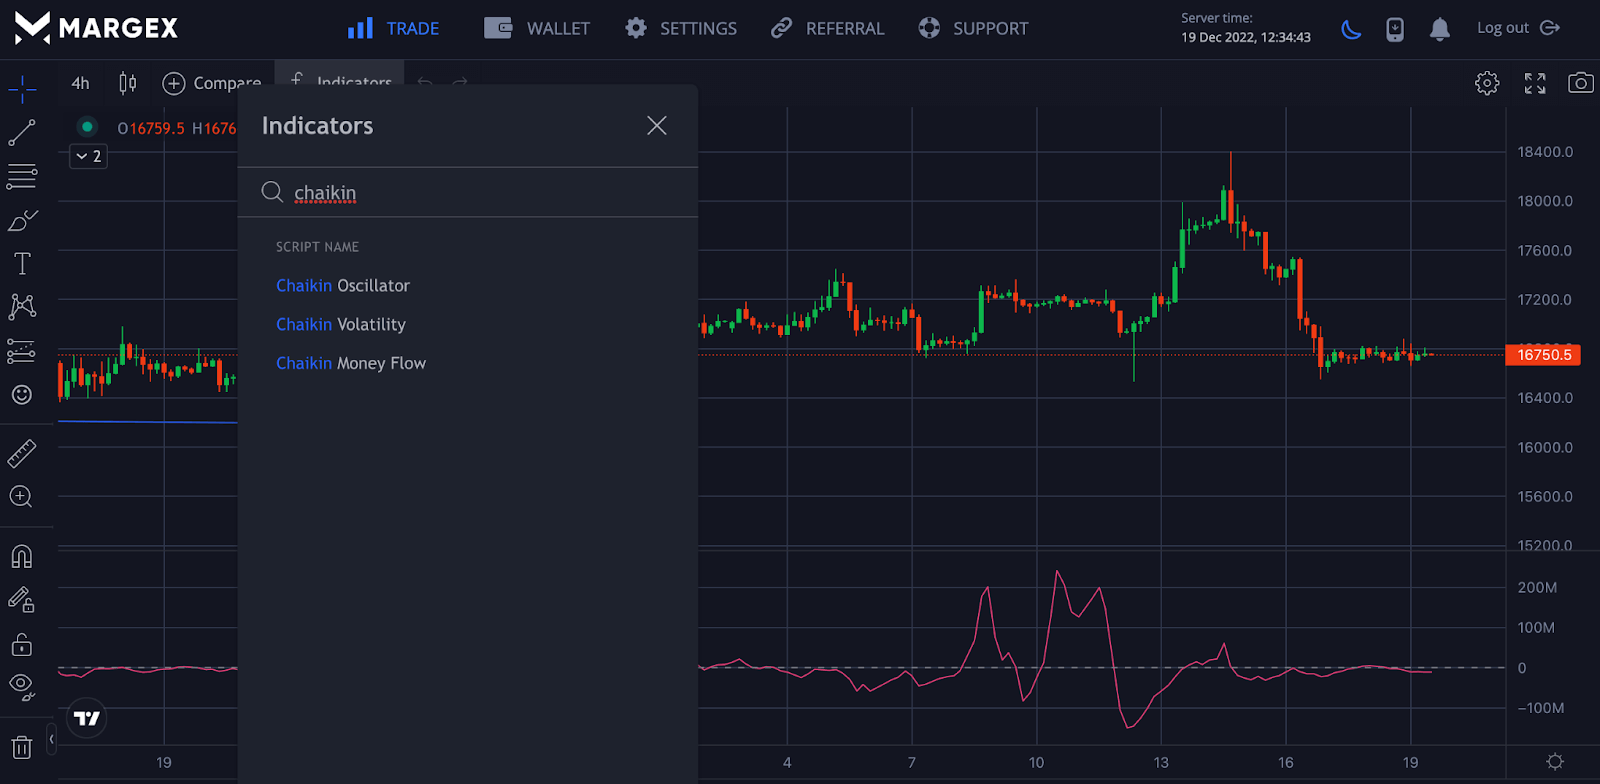
Click on the indicator button to search for different indicators to be applied to trade. For this case, we would search for the Chaikin oscillator, as indicated above in the image, to access the tool.
Best Trading Strategies With Chaikin Oscillator Indicator
Trading the Chaikin oscillator in isolation would lead to a loss of funds, and due to the market conditions, the Chaikin indicator could produce false signals. Let us consider some strategies used to trade the Chaikin oscillation indicator to monitor price movement.
Step 1: Bullish Divergence
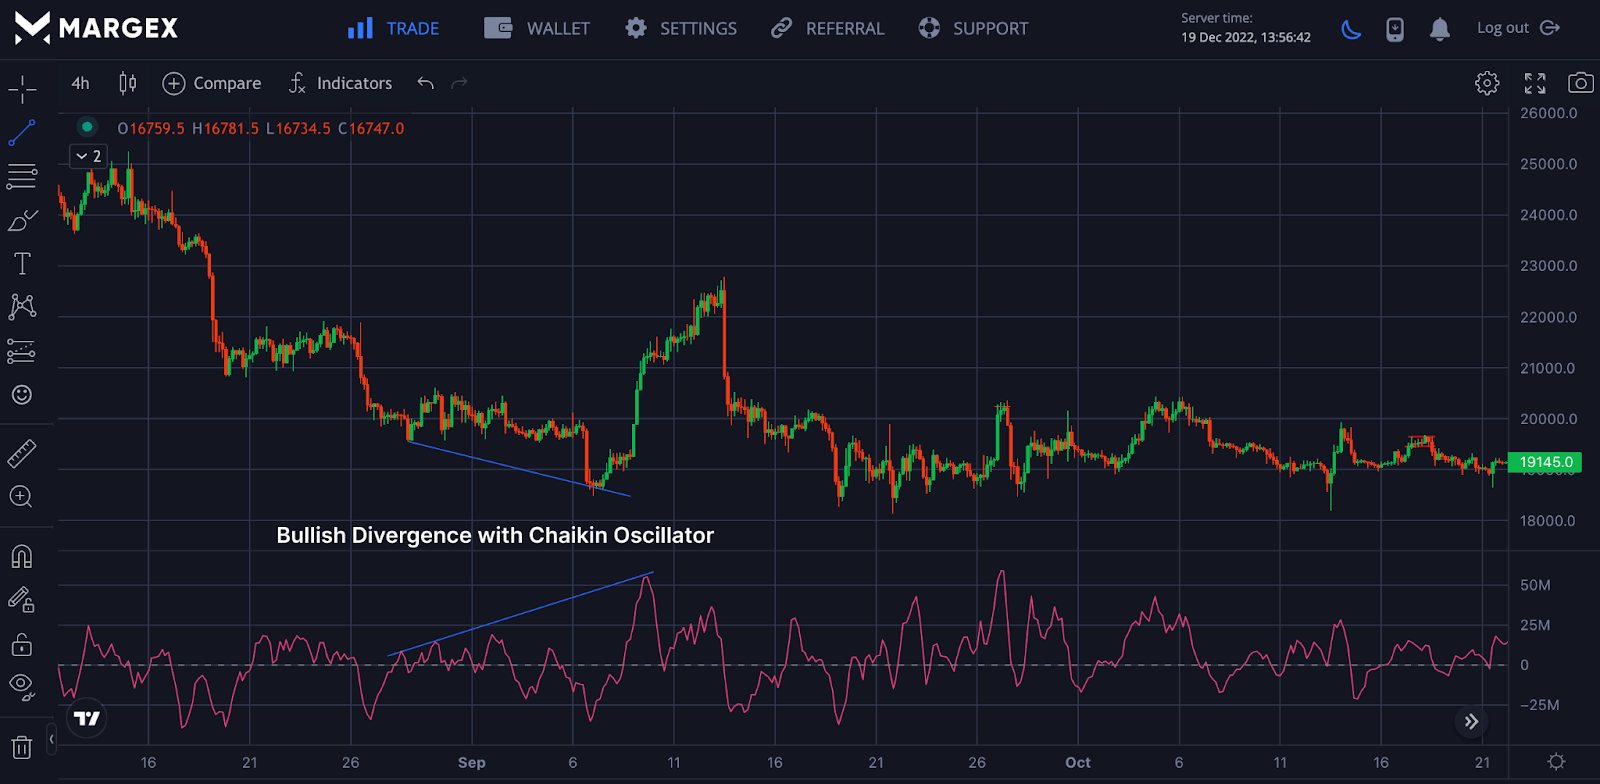
The Chaikin oscillator can also be used to identify a bullish divergence; when confirmed, a trader could look to open a long position for crypto assets when all conditions have been confirmed and a confluence has been reached.
Relative Strength Index (RSI) can be used to identify if the Chaikin indicator was correct as regards the bullish divergence formation. The formation of a bullish divergence led to the price of BTCUSD rising in an upward price direction.
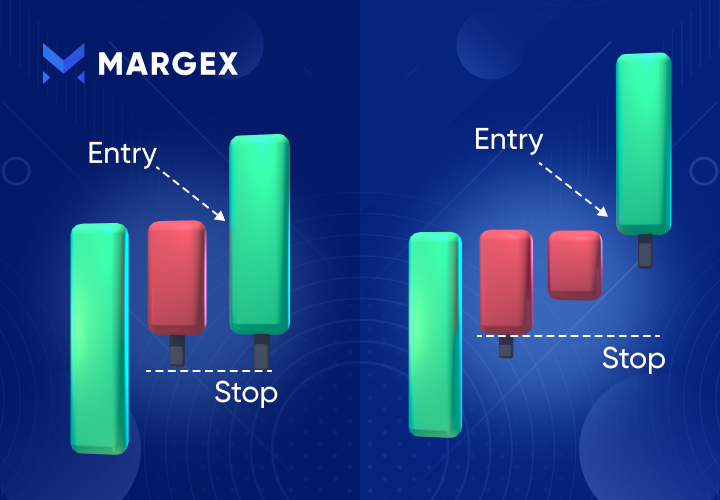
Step 2: Bearish Divergence
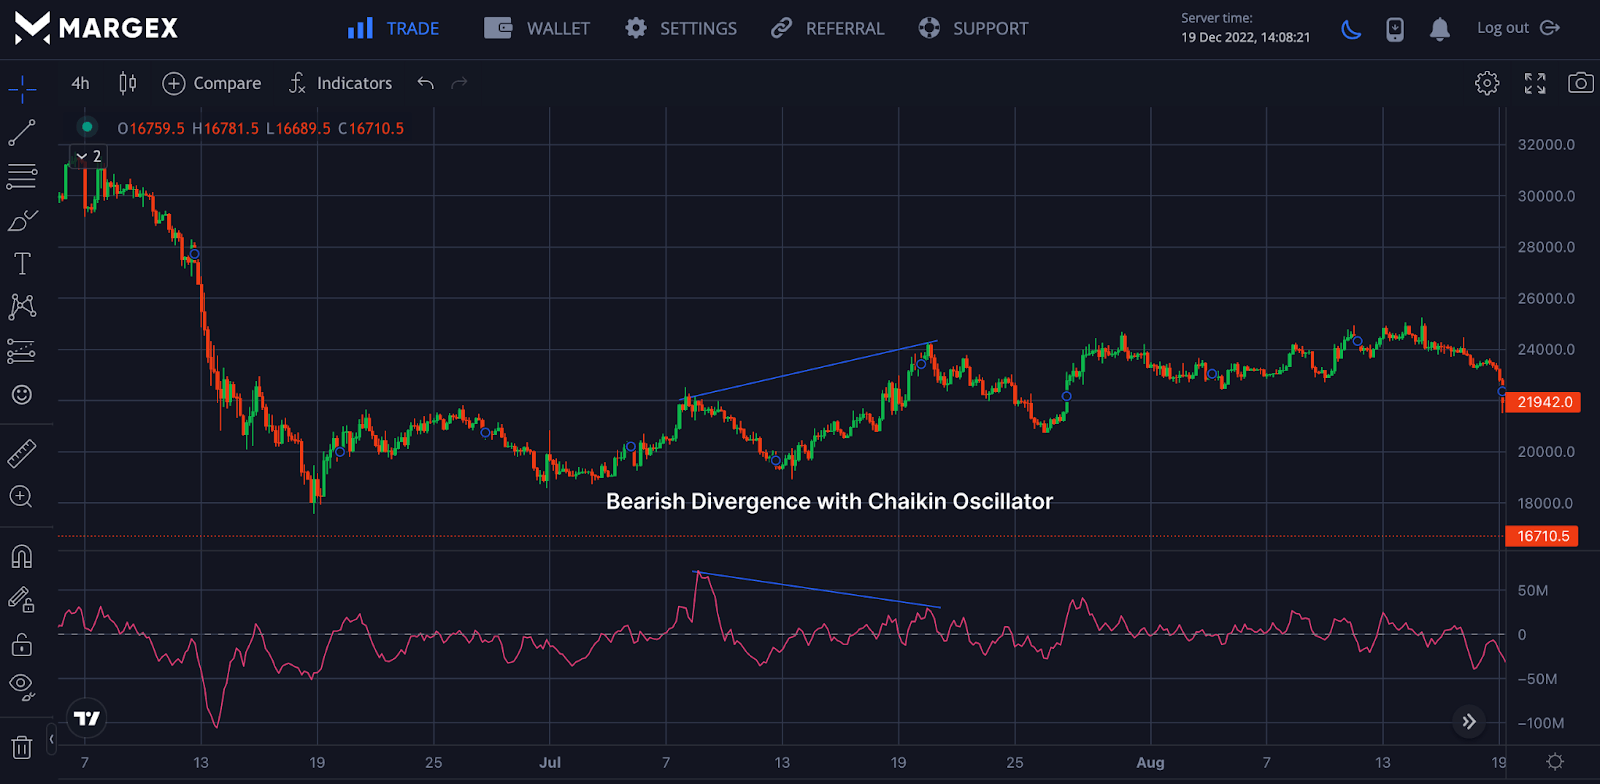
Just as the Chaikin oscillator can be used to spot bullish divergence, so it is with a bearish divergence, however, the trader would be looking to open a short position with the proper stop loss to minimize the risk potential associated with opening a short position.
Frequently Asked Questions (FAQ) About Chaikin Osillator
How Does A Chaikin Oscillator Work?
The Chaikin oscillator is a technical analysis tool that measures momentum or as a volume accumulation indicator that provides technical analysis traders with information about the activities of the market as buyers and sellers participate in the crypto market.
What Does Chaikin Oscillator Measure?
The Chaikin Oscillator measures the pressure of buying and selling of the different traders present at the point of trading.
The Chaikin Oscillator, apart from the price momentum indicator, helps traders to sport divergences in the market as they look to open long or short positions.
How Do You Use Chaikin Volatility Indicator?
Using the Chaikin volatility Indicator to trade solely depends on the traders' preferences; depending on the strategies and what works, most traders adopt the use of the Chaikin volatility indicator.
No technical tool or indicator is 100% safe, and as such, trading the Chaikin volatility indicator in isolation will lead to false signals and would likely cause a loss of funds.