Becoming a successful trader and investor in the financial market requires a lot of effort, time, dedication, and psychology to handle the volatility of trading in the financial market, like crypto, stocks, futures, indices, and forex. It is no secret that the financial market provides traders and investors with great opportunities to make so much money out of it but finding the right moment to take these opportunities is what the advanced trader calls having an edge.
Having an edge in the financial market comes with constant practice to know the market and understand the best strategy to adopt for a market that is in an advancing stage, declining, distribution, and accumulation stage to enable you as a trader to best prepare and stay ahead of the market.
Due to market volatility, selecting the best working strategy is not always possible, and a strategy that works for one trader may not work for another. The trader must develop a working strategy, which includes technical understanding analysis, identifying chart patterns and trends, using indicators, and combining various tools and strategies. Many traders struggle with knowing when to use a specific technical tool or pattern.
Beginners, sophisticated traders, and even investors are constantly looking for the most successful strategies, technical tools, and indicators to help them become profitable by maximizing profit while minimizing risk exposures or implementing the best measures.
As skilled and advanced traders, we want to know the right time to buy and sell an asset to avoid the asset being dumped on us, making us suffer losses in an area of supply or buy into an asset in the case of demand. Most often than not, we look for strategies and patterns that favor this trading.
In this guide, we will learn about a technical analysis strategy used by most traders to time their entries, exits, take profits, and stop losses with the help of a tool called the supply and demand zones strategy.
What Is Technical Analysis and Why Should You Learn It?
Technical analysts use chart patterns, price actions, oscillators, and others, which are what you have been hearing among traders, to help forecast the price movement of particular assets while executing strategies with laser focus mentality to improve profitability and return on investment (ROI)
Technical analysts use cryptocurrency chart patterns, price actions, and other trading tools to determine an asset's current buy zones, sell zones, trend, strength, support, and resistance. Using this information and ideas, traders and investors can strategically construct a trading system that works for them.
Many people dismiss technical analysis because the idea of forecasting financial market assets sounds unrealistic and unattainable. As the crypto space evolves, more sophisticated and better methods of predicting the potential move of an asset have emerged, which involve determining the market trend, whether bullish or bearish.
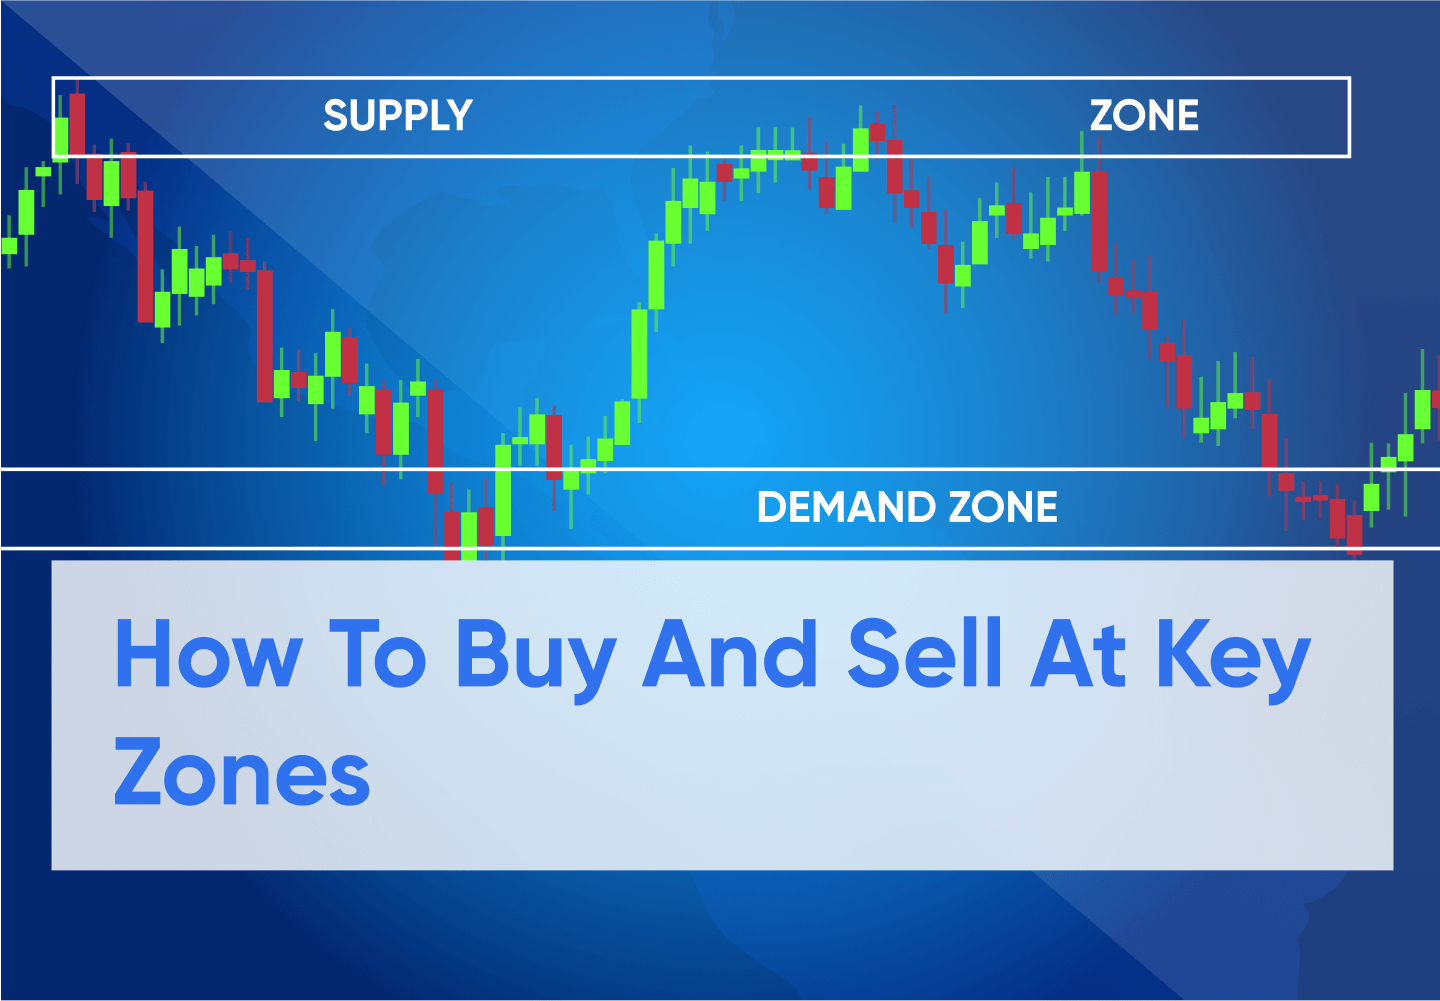
What Are Supply And Demand Zones?
Supply and demand zones are identifiable areas on the crypto chart where prices have been visited on several occasions. Although similar to support and resistance, these are zones or areas and not lines, as seen in the case of support and resistance.
It is key for you to trade with smart money; you need to understand how demand and supply work and how the crypto market has been identified to move in cycles. Different market cycles take place in the crypto market, but the most common ones include the accumulation phase, distribution phase, uptrend phase, and downtrend phase.
Demand Zone
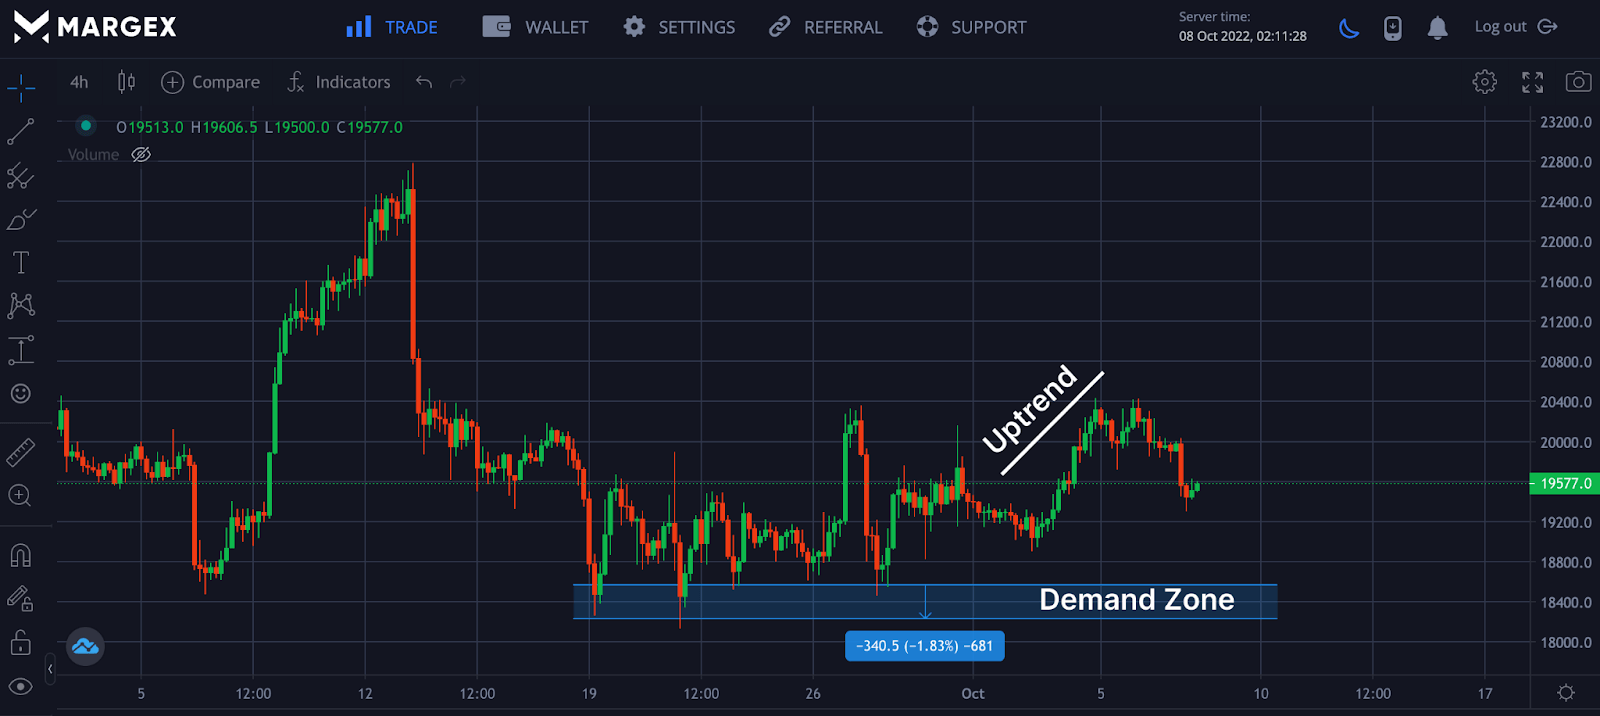
A demand zone is an area with more orders for traders willing to buy at the lowest price for an asset. This area occurs due to the price being found below its current price, and there are more orders to purchase the asset by traders and investors, making the potential to buy at this region intense and highest. Due to the huge demand in this area, the number of buyers surpasses the sellers creating a trend reversal for an asset at this stage.
From the chart above, the price of the BTCUSD pair formed a demand zone at around $18,400, with more buyers willing to buy at this range leading to price reversal whenever it touches this range.
Supply Zone
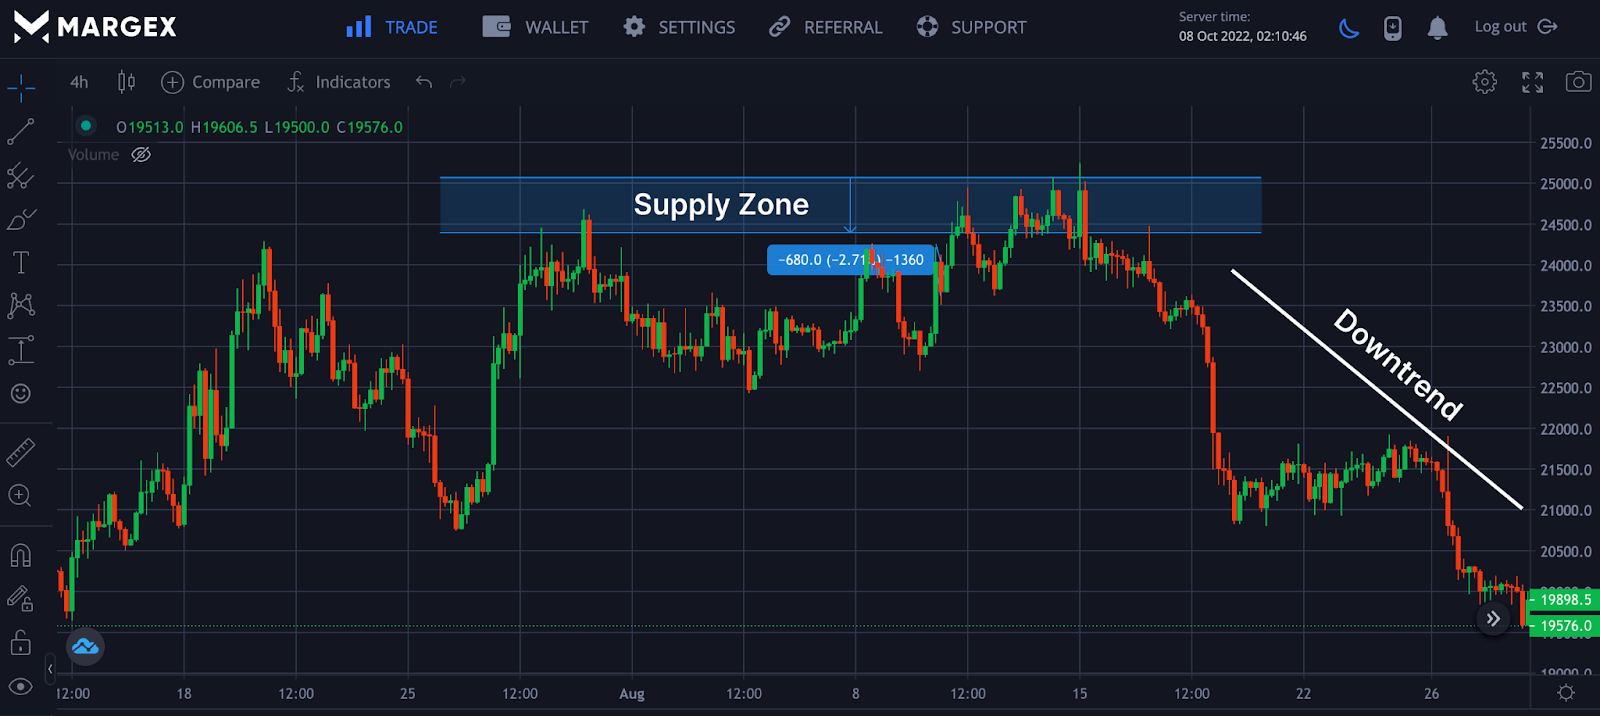
A supply zone is an area in which there are more orders for traders willing to sell at the highest price for an asset. This area occurs as a result of the price being found above its current price and there are more orders to sell the asset by traders and investors making the potential to sell and do away with the asset at this region to be intense and highest. Due to the huge supply in this area, the number of sellers surpasses the buyers as their orders get filled creating a trend reversal for an asset at this stage.
From the chart above, the price of the BTCUSD pair formed a demand zone at around $18,400 with more buyers willing to buy at this range leading to price reversal whenever it touches this range.
Different Types Of Supply And Demand Formations
There are different demand and supply zone pattern formation types, with most traders trading the most popular ones. Let us discuss the common demand patterns you could identify, considering price reversal and continuation.
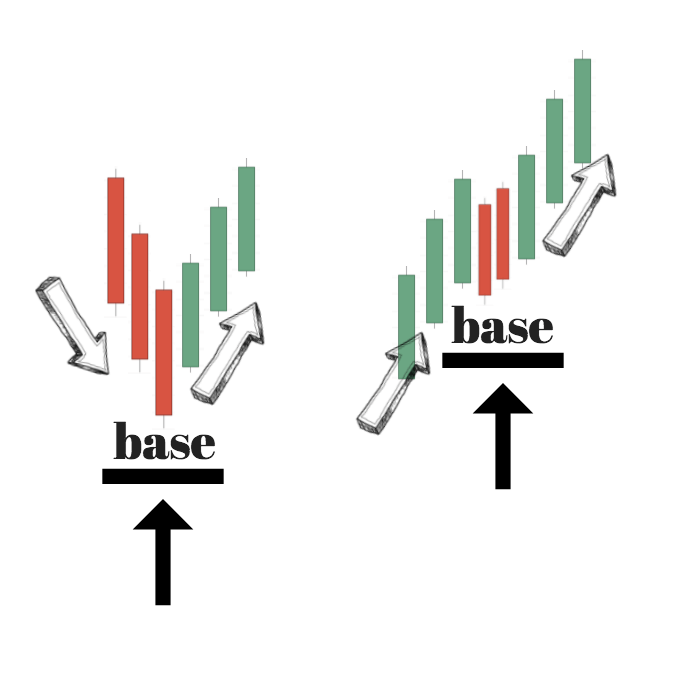
In the image above, two potential events could lead to the formation of demand patterns. In the first one on the left, we can see the price going down (D), followed by the formation of the base (B) before the price continues going up (U). This can be identified as the DBU setup with price forming a shape like a V shape. This setup can be identified as downward, base, and upward movement.
In the right image above, prices form an uptrend (U) first, followed by the formation of the base (B), followed by buyers pushing the price upwards with what is known as price continuation. This setup can be identified as a UBU setup, meaning upward, base, and upward movement.
Let us look at the supply zone pattern formation in the case above.
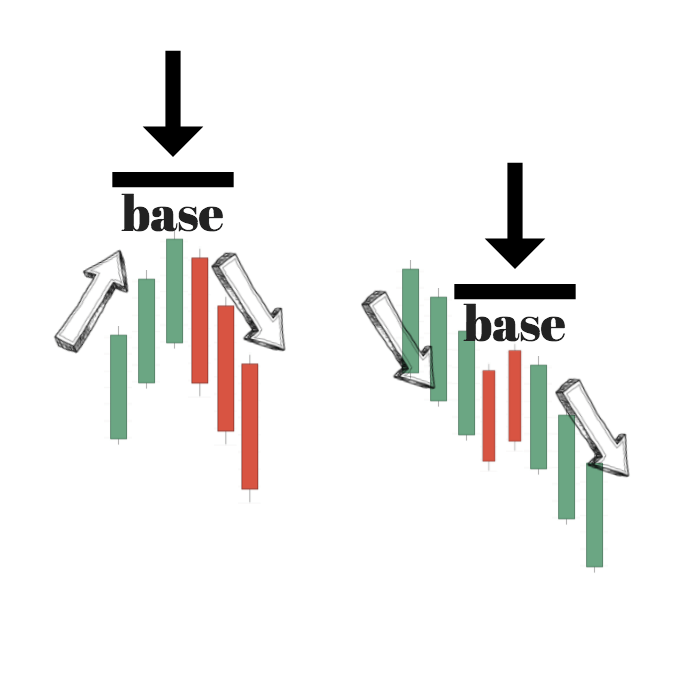
From the left image above, at the initial stage of the supply zone, we have the prices going up (U), followed by the formation of the base (B), and finally, the price going down (D). This formation is called the UBD setup.
In the image on the right above, there was an initial going down (D), followed by a base formation called the base (B), and to complete this pattern, the price continues its trend to the downside as sellers dominate this market called the downward movement (D). This setup is called the DBD setup.
From the above, we have four pattern formations for supply and demand formation zones: DBU, UBU, UBD, and DBD. You don’t need to memorize the abbreviations; all you need do is master their formation and patterns formed.
How To Find Supply And Demand Zones In Trading
One of the ways that traders identify market imbalances is a way of finding demand and supply zones. These market imbalances lead to big price shifts or price actions based on price movement. During high demand, prices rally upward as demand exceeds the supply for prices. While in the case of supply, sell prices exceed buyers' prices. Let us focus on key areas and tricks you could use to find supply and demand zones.
Step 1: Spot The Current Price
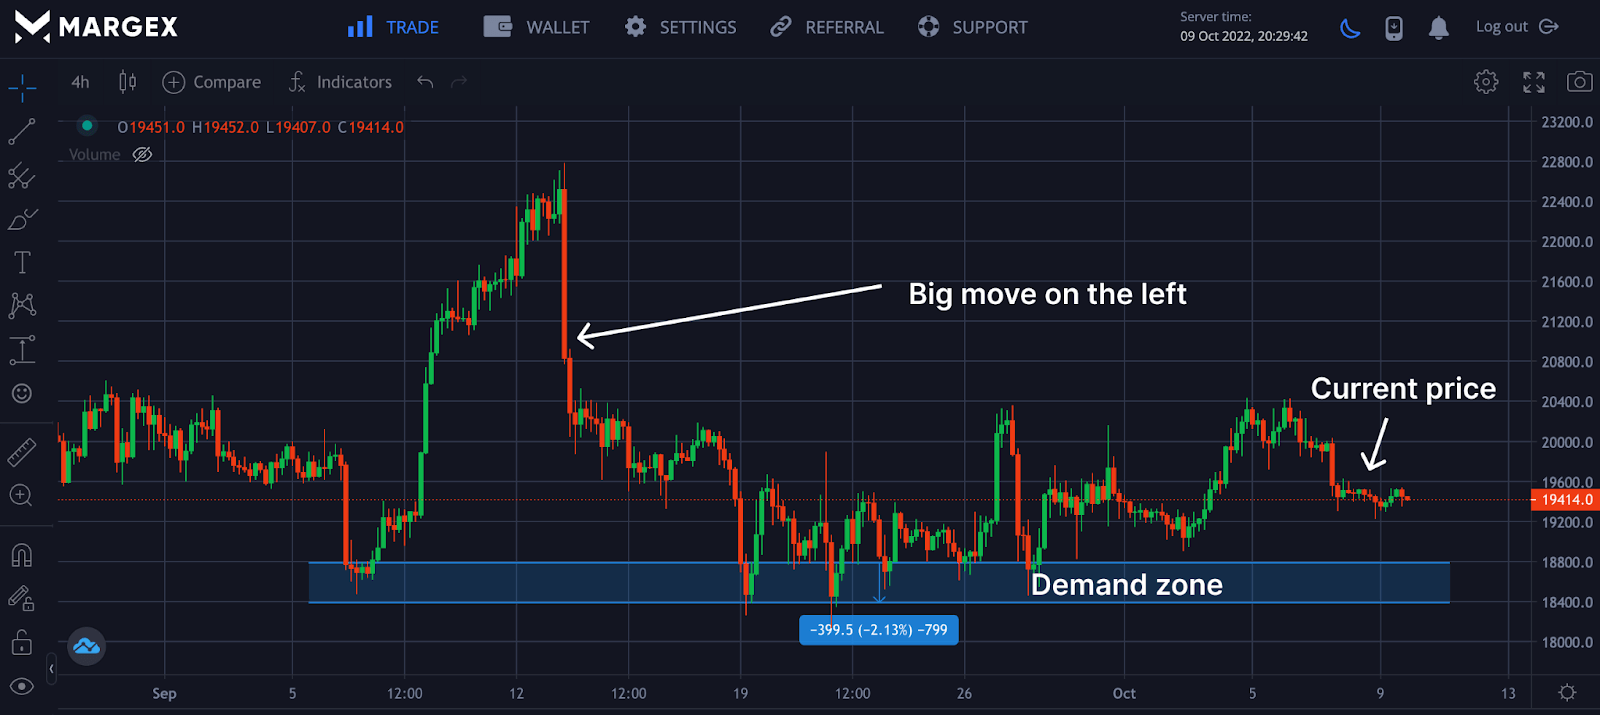
From the chart above, the price of the BTCUSD pair saw a huge price movement in the downtrend, with price finding some base as prices continue to range with what looks like the support as prices have found a base in this area as prices bounce off acting as demand zones for buyers.
Usually, prices bounce off from the demand area as buyers surpass the sellers in this zone or area.
Step 2: Identify Extended Range Candles (ERCs)
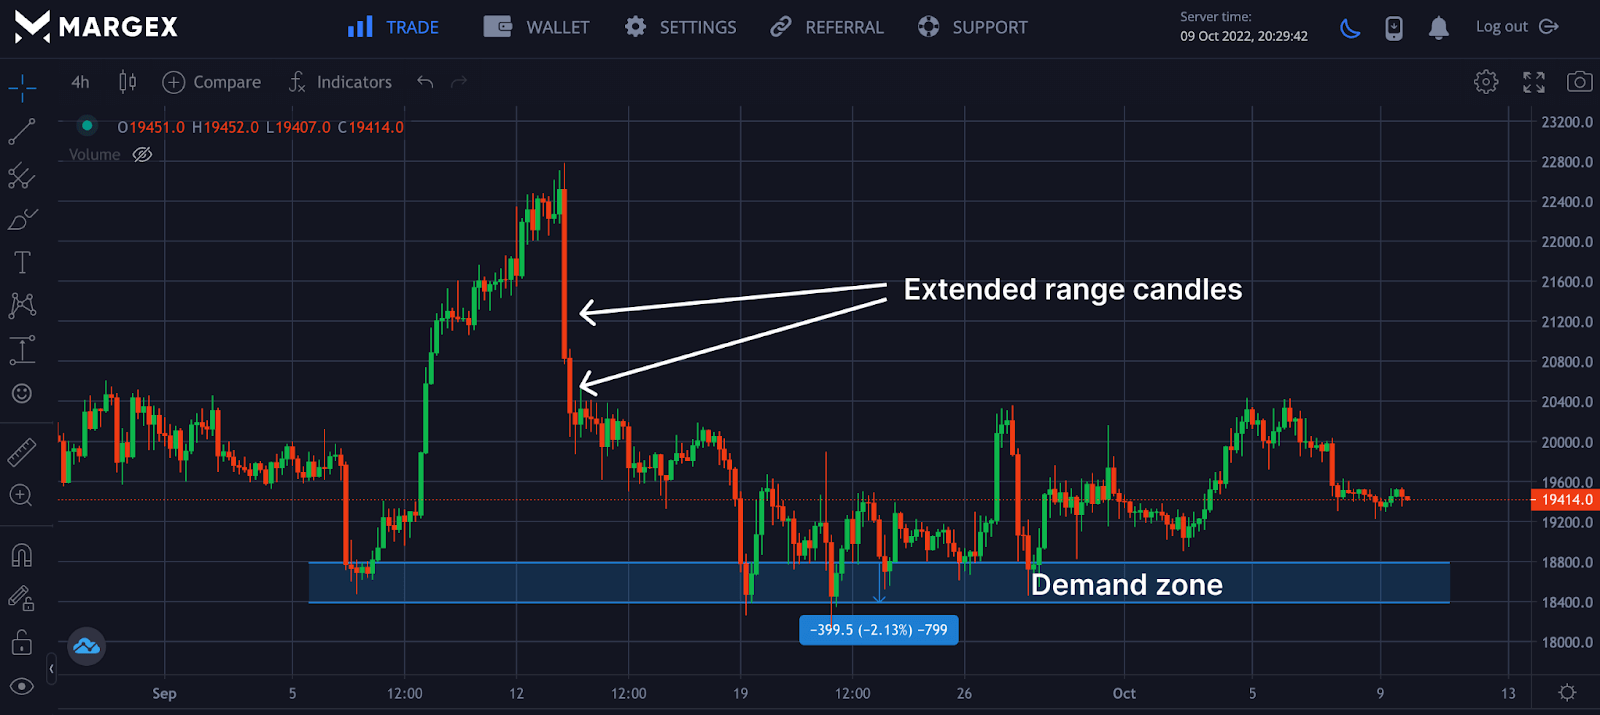
The extended range candles (ERCs) area includes a zone where candles with little or no wicks are dominant, and prices tend to fall or rise the most due to price volatility before a base is formed. ERCs, tell the trader the trend reversal could be getting to the base formation, which will detect the next price movement. During price ranges at the base, sellers and buyers are locked in price as they try to determine the next price movement.
Step 3: Identify Origin of the Price Movement
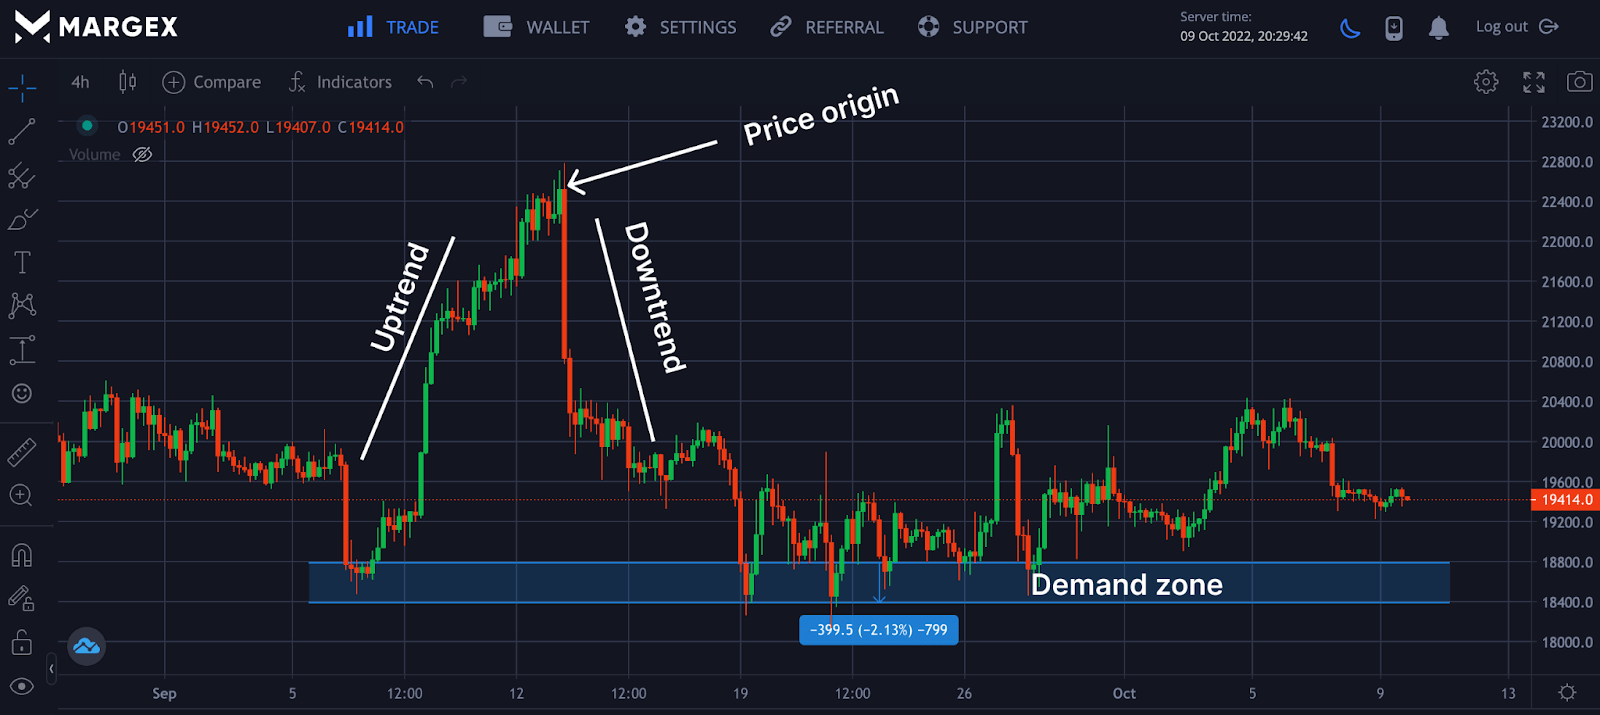
Finally, looking at the chart above, the BTCUSD pair had a price rally as buyers pushed the price higher, followed by a sharp decline in price. These are the ERCs points or areas, and a base formation follows this. Identifying the ERCs would help you locate the price origin and identify if there was going to be a possible uptrend or downtrend trend reversal.
Other Methods To Identify Supply And Demand Zone
Apart from the steps discussed above, there are other ways traders use to identify supply and demand zones that can easily be adopted.
Moderate Volatility
A supply or demand zone typically shows a narrow price pattern with lots of wicks or shadows. The narrow the price actions of the supply or demand zone, the higher the chances of price moving best in that direction.
The Spring
This is a quick movement in the opposite of the price direction. This movement sometimes looks like a false breakout, and when this occurs, traders are left trapped in what looks like a bull or bear trap. Long candles dominate this region with wicks looking like pin bar candlesticks.
Strong Price Leaving Zone
At this point, the price has left the supply zone and has begun a new trend, creating a significant imbalance between buyers and sellers, resulting in strong and explosive price movements. Always remember that the stronger the breakout, the better the demand zone, and the more open interest there will usually be - especially if the accumulation time was relatively short.
When the price moves from a bearish trend to a strong bullish trend, there must have been a significant amount of buy interest entering the market, absorbing all sell orders and driving the price higher. Seek out extremely strong turning points; these are frequently high-probability price levels.
How To Trade Supply And Demand Zone Pattern On Margex
Margex is a bitcoin-based derivatives exchange that allows traders to trade up to 100X leverage size, and at the same time, you can stake your tradable crypto assets for up to 13% APY.
Margex unique staking while trading features set its platform apart from other exchanges in the crypto industry. The cool thing is that there are no lockup periods for this staking, and all staking rewards are sent daily into your staking balance with the help of Margex automated system. Margex ensures all trade and assets remain safe (SAFU).
How To Enter Demand And Supply Using Price Action?
Trading, in theory, sounds very simple and interesting until you apply it in a real-life situation which will test your understanding of applying these concepts to remain profitable while minimizing risk. Let us consider some concepts you can employ.
Trend Reversal With Divergences
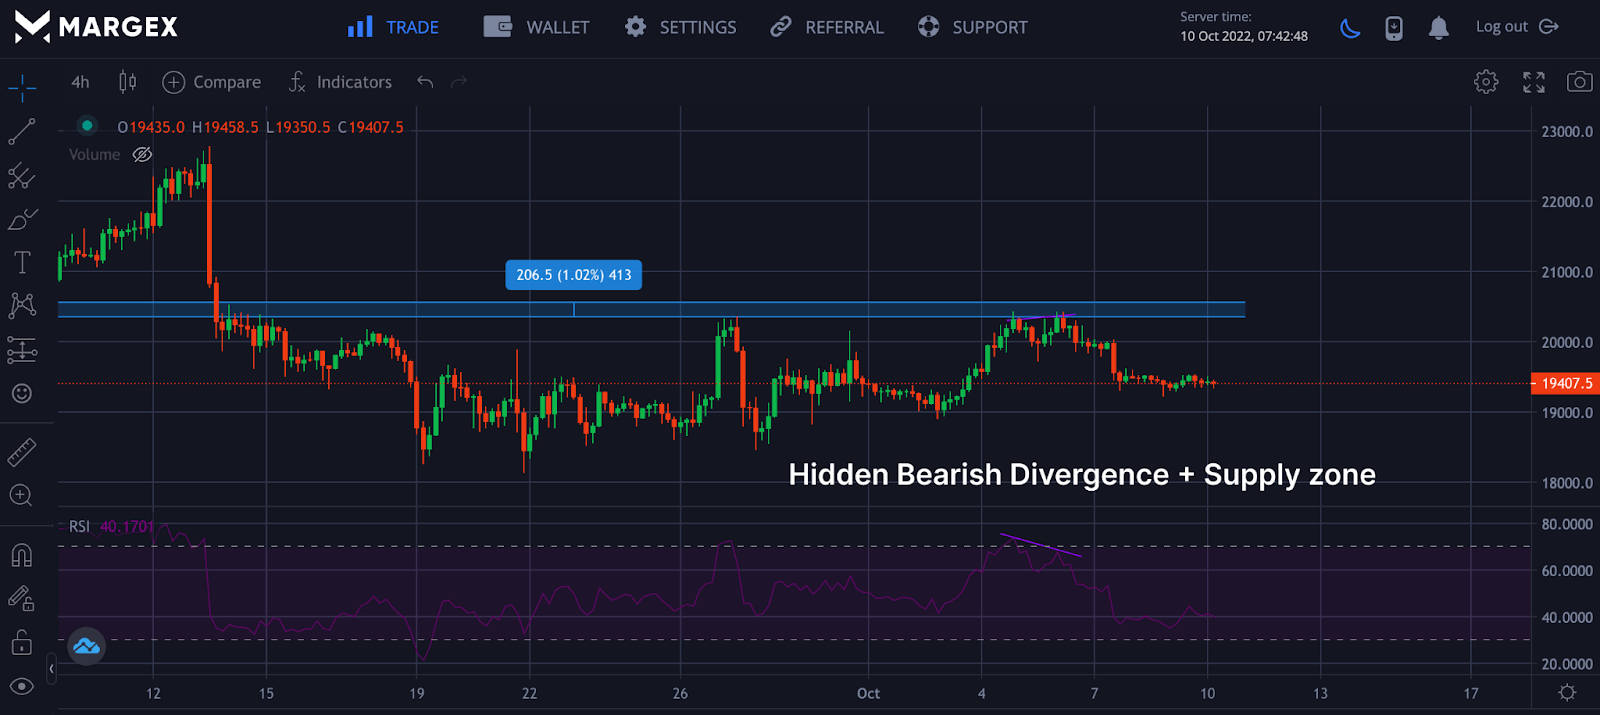
From the image above, the BTCUSD pair showed a hidden bearish divergence close to the supply zone, indicating a potential trend reversal was imminent in the four-hour timeframe. It would be wrong to open a long position at the supply zone unless this area was breached or flipped into a demand zone. A good trader would look for a short opportunity when all criteria have been fulfilled for that trade.
Support And Resistance Area
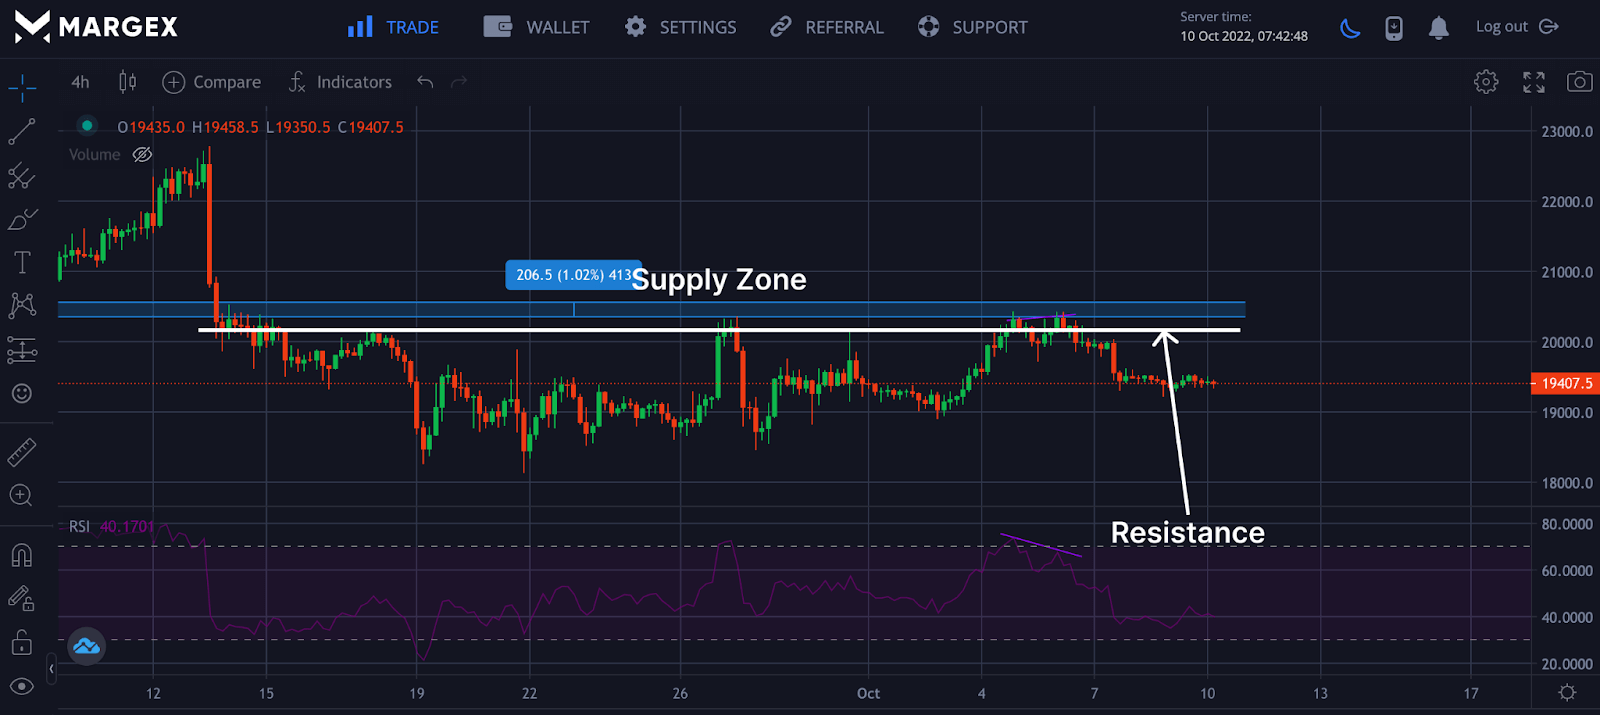
Supply and demand zone are also support and resistant areas as these two points and zones work naturally together, and it would be good to have them while trading as they will lead to high-profit setups and give you an edge during trading. By combining traditional support and resistance concepts with supply and demand, traders can better understand price movements. You often see the supply zone appearing just above the resistance zone, and a trader could look for a short-entry position.
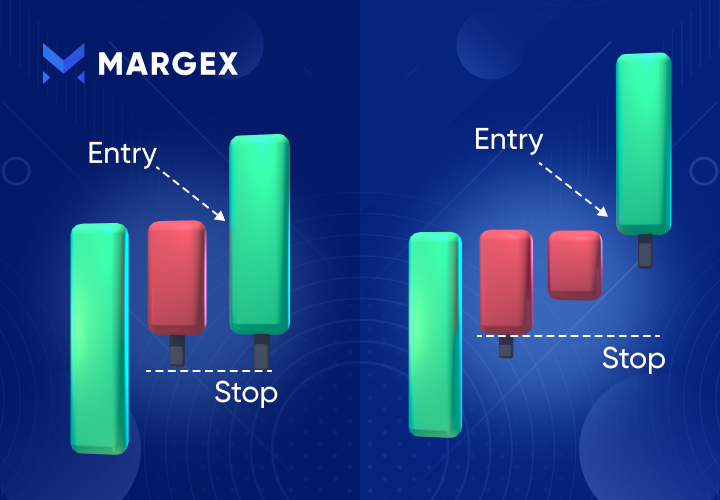
Entry, Stop Loss And Take Profit
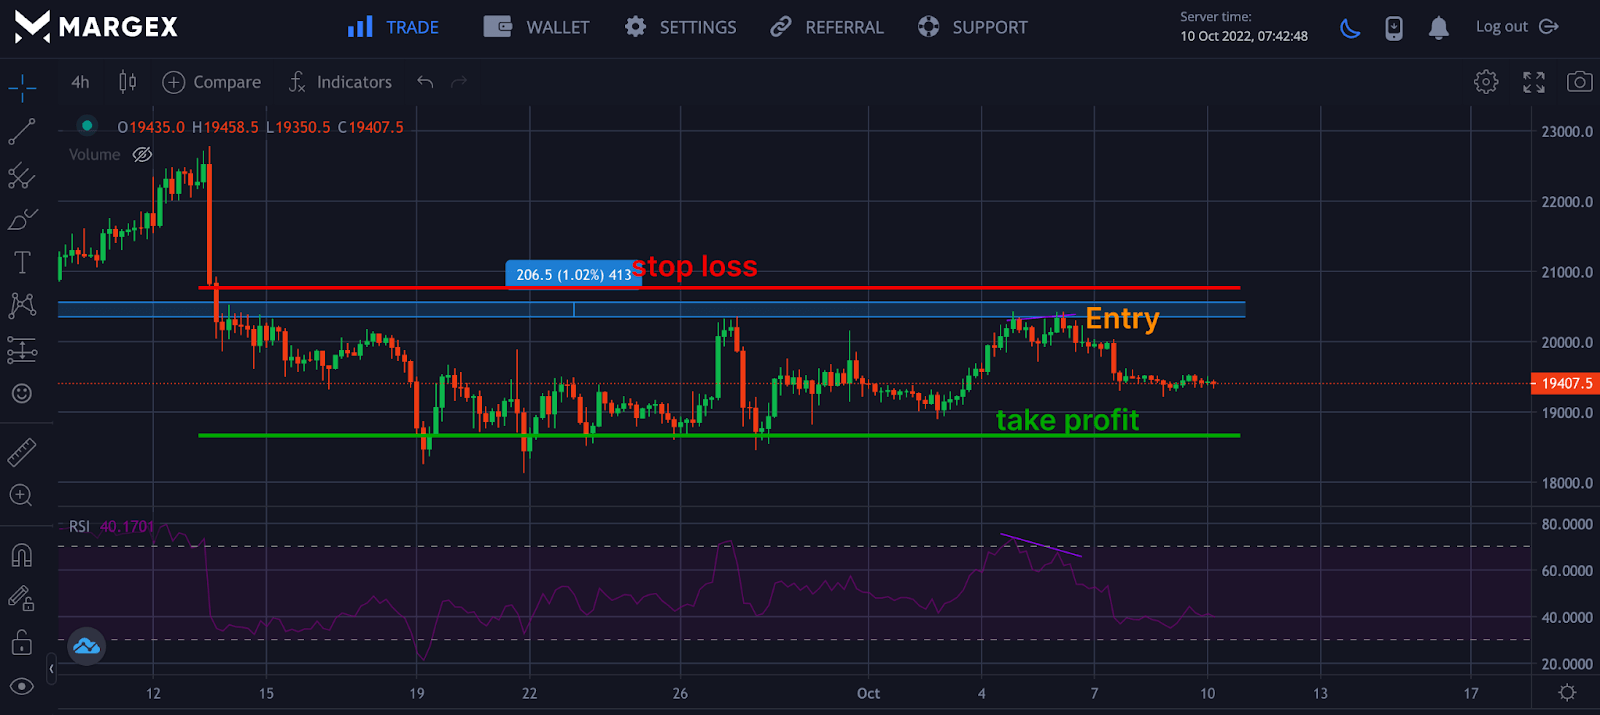
Trading is all about managing risk and maximizing profit, which requires stopping loss and taking profit after determining your entry point for every trade. Different traders have their way of trading with supply and demand zones; having a plan and sticking to it helps you execute your strategy correctly. From the image above, we can see an entry at the supply zone with a stop loss set some distance away from the supply zone, taking profit at the next support or before the support area.
Frequently Asked Question (FAQ) On How To Trade The Supply And Demand Zones
Learning to trade the supply and demand zones with other strategies gives you an edge over other traders and positions you for better trades and gain. But there are a few misconceptions when it comes to trading this strategy. Let us discuss some of these questions asked by traders.
How To Draw Supply & Demand Zones
Drawing the supply and demand zones requires you to understand these zones well and know the difference they have with support and resistance. Although supply and demand zones can be similar to support and resistance, they are more clearly seen and identified as zones or areas, not just points.
How Can I Identify The Supply-Demand Zone On The Chart?
Identifying supply and demand zones on the chart is not difficult and can be seen with your eyes more often than other patterns. Look for huge price movement, locate the origin of price movement and watch out for base formation with the areas marked for identification.
What Are The Best Supply And Demand Trading Strategies?
Trading the supply and demand zones with other trading strategies gives you an edge as a trader over the market and places you for better profitability. These strategies include divergences, pin bar patterns, support and resistance points, and Fibonacci retracement points.